INTRODUCTION
Hospital food provision is a cornerstone of care. It impacts patient and health system outcomes including satisfaction, clinical outcome, and costs [
1–
3]. Medical nutrition therapies, such as fortifying foods, liberalizing diets, nutrition supplements, and offering food choices have improved patient intakes of energy and protein [
3]. Poor food intake may be caused by patients not being able to open packages, missing meals, or not liking the food [
4]. Patients who are malnourished and consume 50% or less of food on their meal trays in hospitals have longer length of stay and increased risk of mortality [
5]. National foodservice standards have been established in countries with an aim to optimize food provision to reduce risk for malnutrition [
6–
10]. The Council of Europe adopted a resolution in 2003 [
6], which acknowledges the problem of malnutrition in hospital, declares access to food in hospital as a fundamental human right [
11], and provides evidence-based recommendations related to food and nutritional care in hospital including standards for hospital foodservice provision. Currently, there are no common pan-Canadian standards for hospital foodservice related to malnutrition, and little is published about foodservice practices in Canadian hospitals. A Food in Health Care Working Group of the Canadian Malnutrition Task Force (CMTF), including foodservice directors and clinical nutrition leaders from across Canada, was formed in 2018 to address hospital foodservice practices related to malnutrition. Building upon the Integrated Nutrition Pathway for Acute Care (INPAC) [
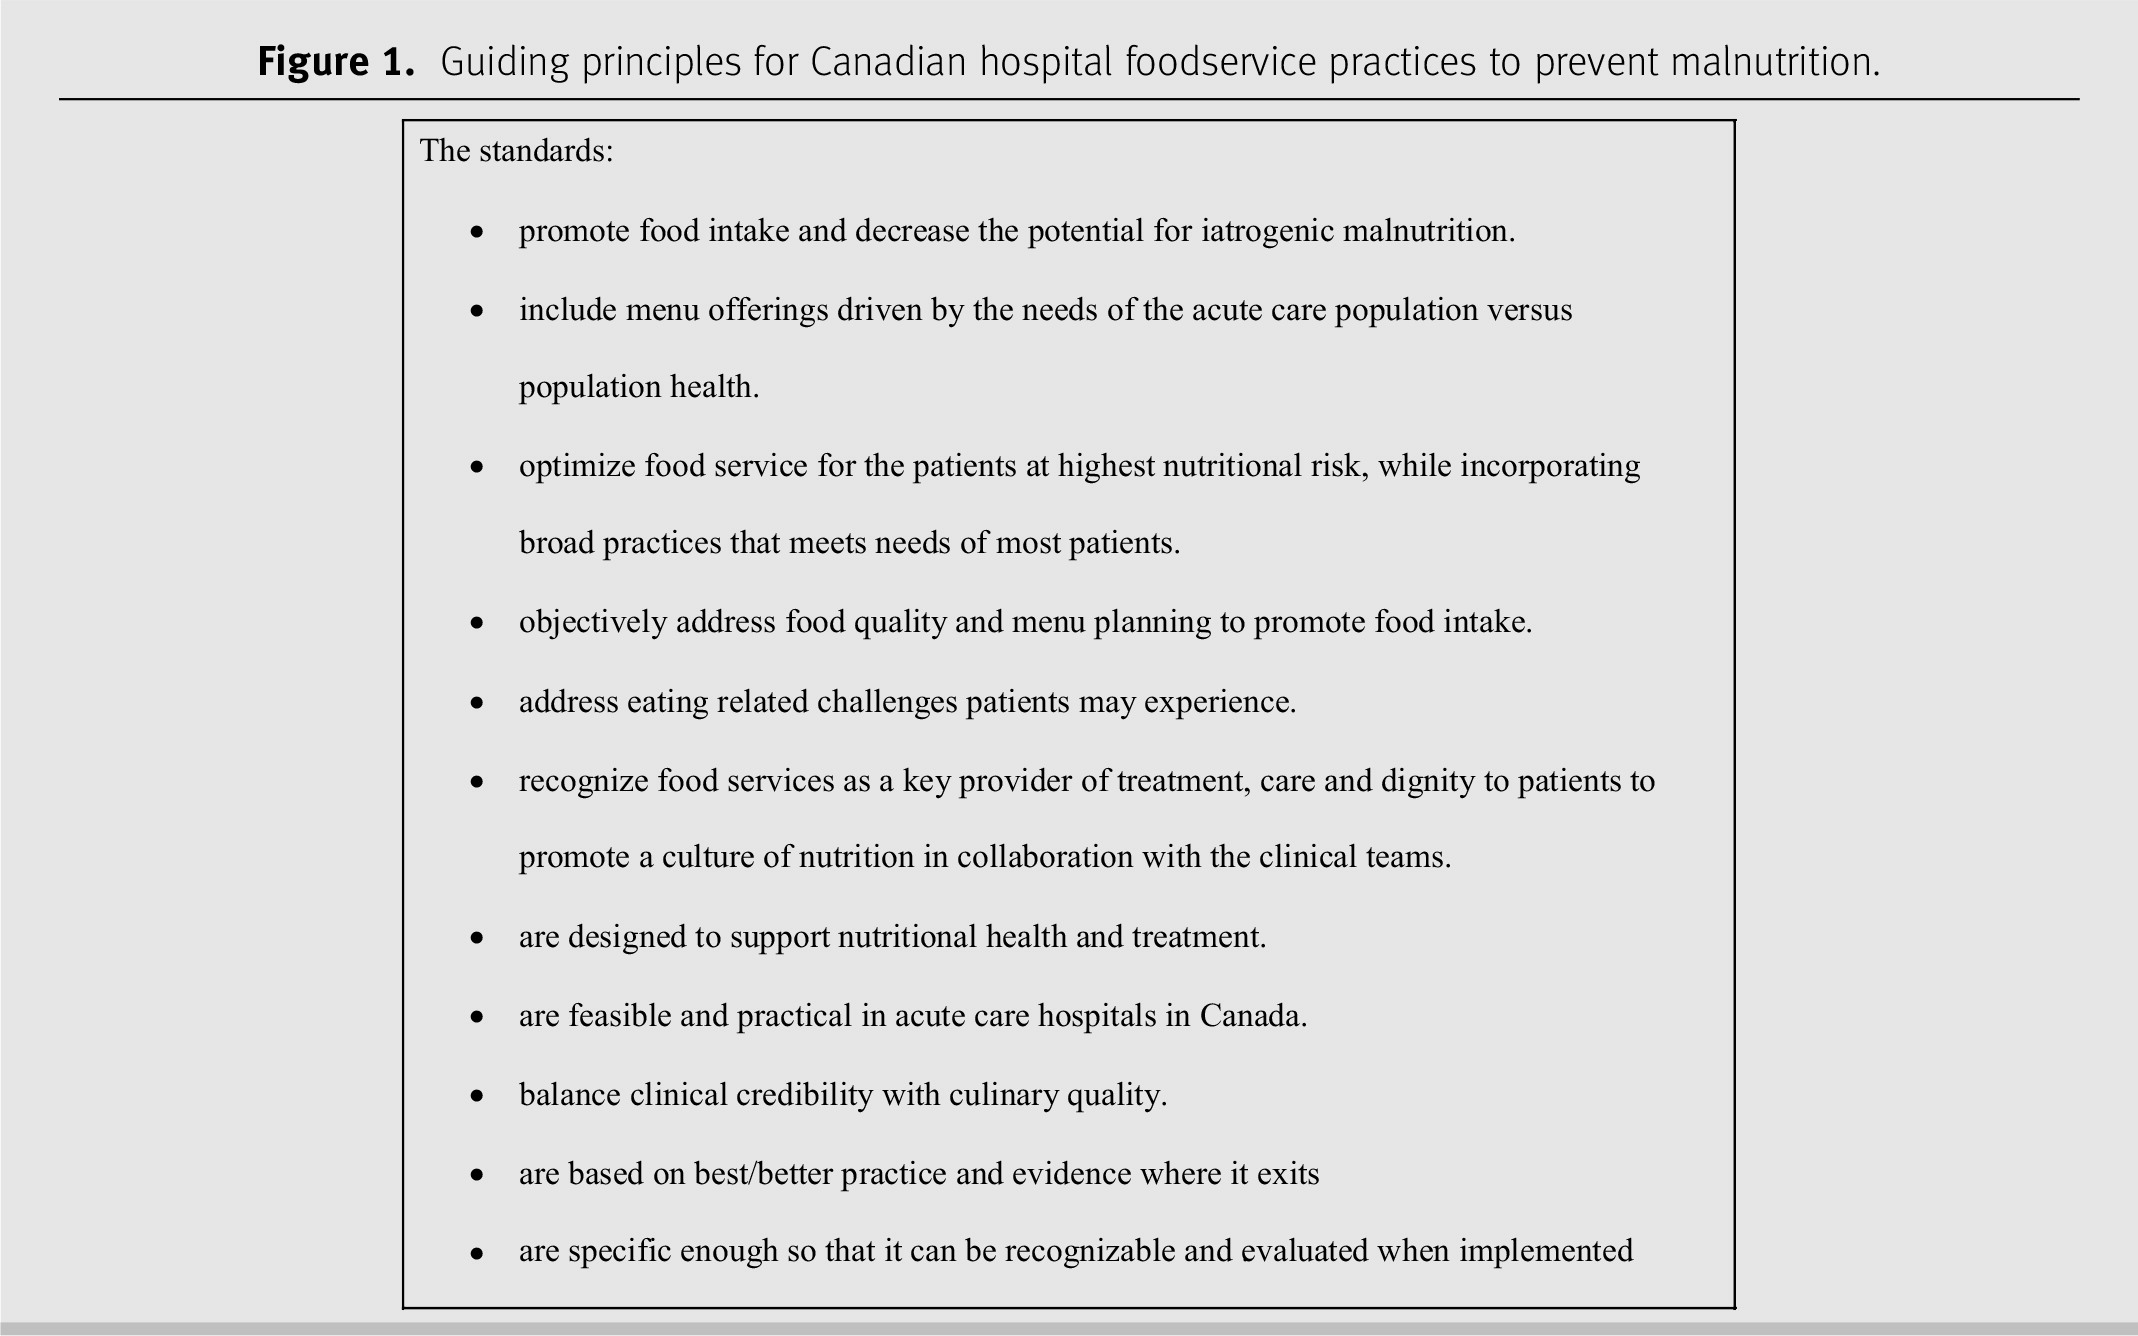
12], the working group developed guiding principles for Canadian hospital foodservice practices to prevent malnutrition (
Figure 1). Applicability/validity of these guiding principles towards developing a national hospital foodservice standard was assessed by the group through a study of current practice, barriers, and enablers of foodservices in Canadian hospitals.
METHODS
Hospital foodservice evidence and standards [
13,
14] and the guiding principles informed the scope of the Canadian Hospital Foodservice Practice survey. The diverse hospital foodservice practices identified were deemed well suited to be assessed by survey. The co-chairs (JS, HF) developed a preliminary draft that was revised collaboratively and iteratively by 14 working group members from 8 Canadian provinces/territories and representing CMTF, Dietitians of Canada, the Canadian Society of Nutrition Management, and Nourish Healthcare. The survey included 55 questions on hospital demographics, foodservice organization and interdisciplinary collaboration, food production and meal service, menu standards, diets and meals, practices to prevent malnutrition, outcome assessment, and barriers/enablers to optimise practice (
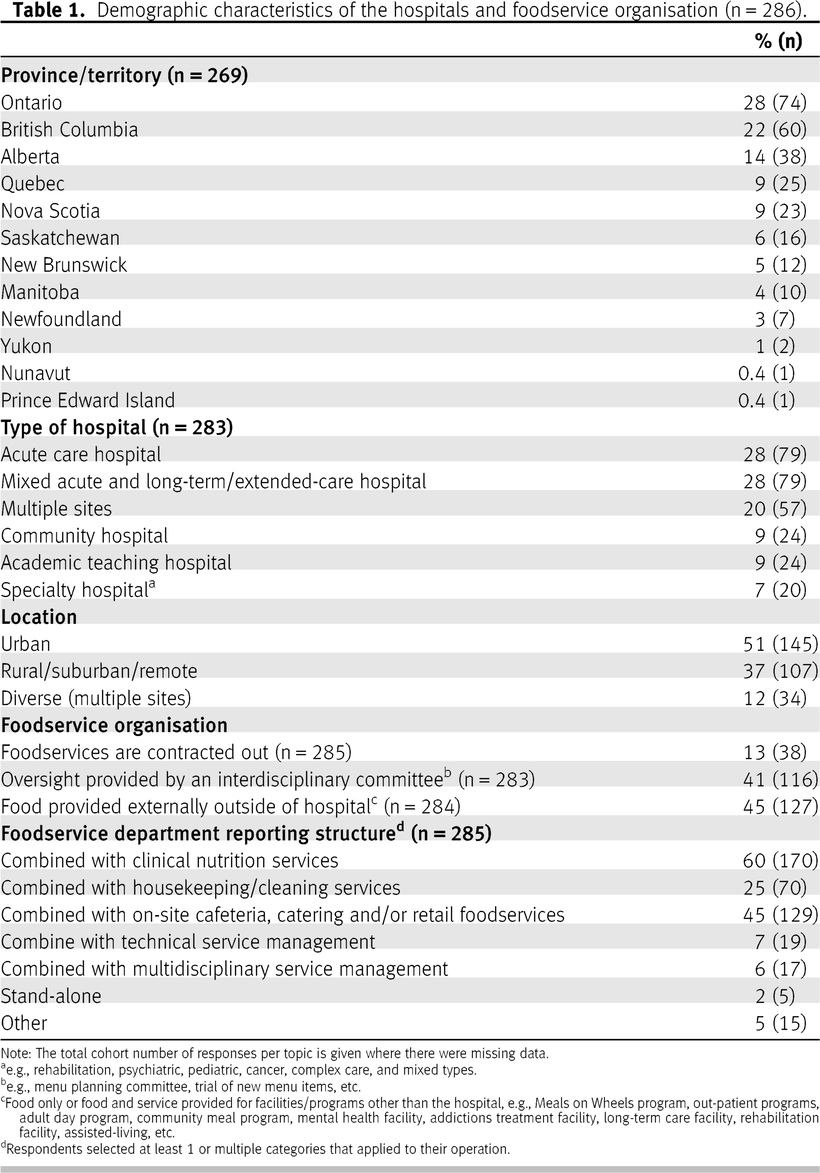
Supplementary File 11). The working group recruited participants with extensive knowledge on the survey topics (inclusion criteria: foodservice/nutrition manager in a Canadian hospital) through health authorities and professional networks in their respective regions from July to September 2018. Recruitment of participants aimed at a diverse sample from across Canada including various types of hospitals and geographical locations (
Table 1). Potential participants were invited by e-mail with a link to provide informed consent to complete the self-administered survey via Survey Monkey. The survey was estimated to take 25 minutes to complete with no incentive offered. The study was approved by the Langara Research Ethics Board.
Quantitative data were analysed using IBM-SPSS® Statistics (version 24.0, 2016, Armonk, New York) by frequency for categorical/ordinal variables and mean ± standard deviation (SD) or median ± interquartile range (IQR) and/or maximum and minimum for normally or non-normally distributed continuous variables, respectively. Qualitative questions were thematically coded manually by JS and a research assistant (TS) based on the question form and a review of all responses. Additionally, a qualitative research consultant (LEL) used NVivo© (QSR International, version 12 Plus, 2018, Burlington, Massachusetts) for in-depth analysis. NVivo autocoding generated a list of themes (based on frequency) to provide initial insight on main themes and prioritize subsequent manual coding. LEL read responses to prioritize questions in depth to elicit key words and phrases commonly reported in the responses. Key words and phrases were queried to collate responses of similar meaning and initial coding was queried for additional information. When the review of the question responses and queries failed to yield any substantial new information, LEL outlined the qualitative analysis including topic descriptions, number of references to phrase/word, and key quotes illustrative of responses. The French data set was translated into English, collated with the English data set, and coded by themes of the English data set.
RESULTS
A total of 598 invitation e-mails were sent, with 400 individuals responding to the invitation, and 114 were excluded related to no informed consent (n = 9), no responses (n = 88), only demographic responses (n = 8), international (n = 1), not a hospital (n = 7), and other (n = 1). Forty eight percent (n = 286) of requested surveys were included in the analysis with 90% completed in English (n = 258) and 10% in French (n = 28).
Demographics
Responses from across Canada included 51% (n = 145) from urban locations (
Table 1). Most hospitals were acute care or mixed acute and long-term/extended care. Of the respondents, 20% (n = 57) were responsible for multiple facilities, almost half (n = 126) also provided foodservices outside of the hospital, and 13% (n = 38) had foodservices managed by a contract provider.
Foodservice system
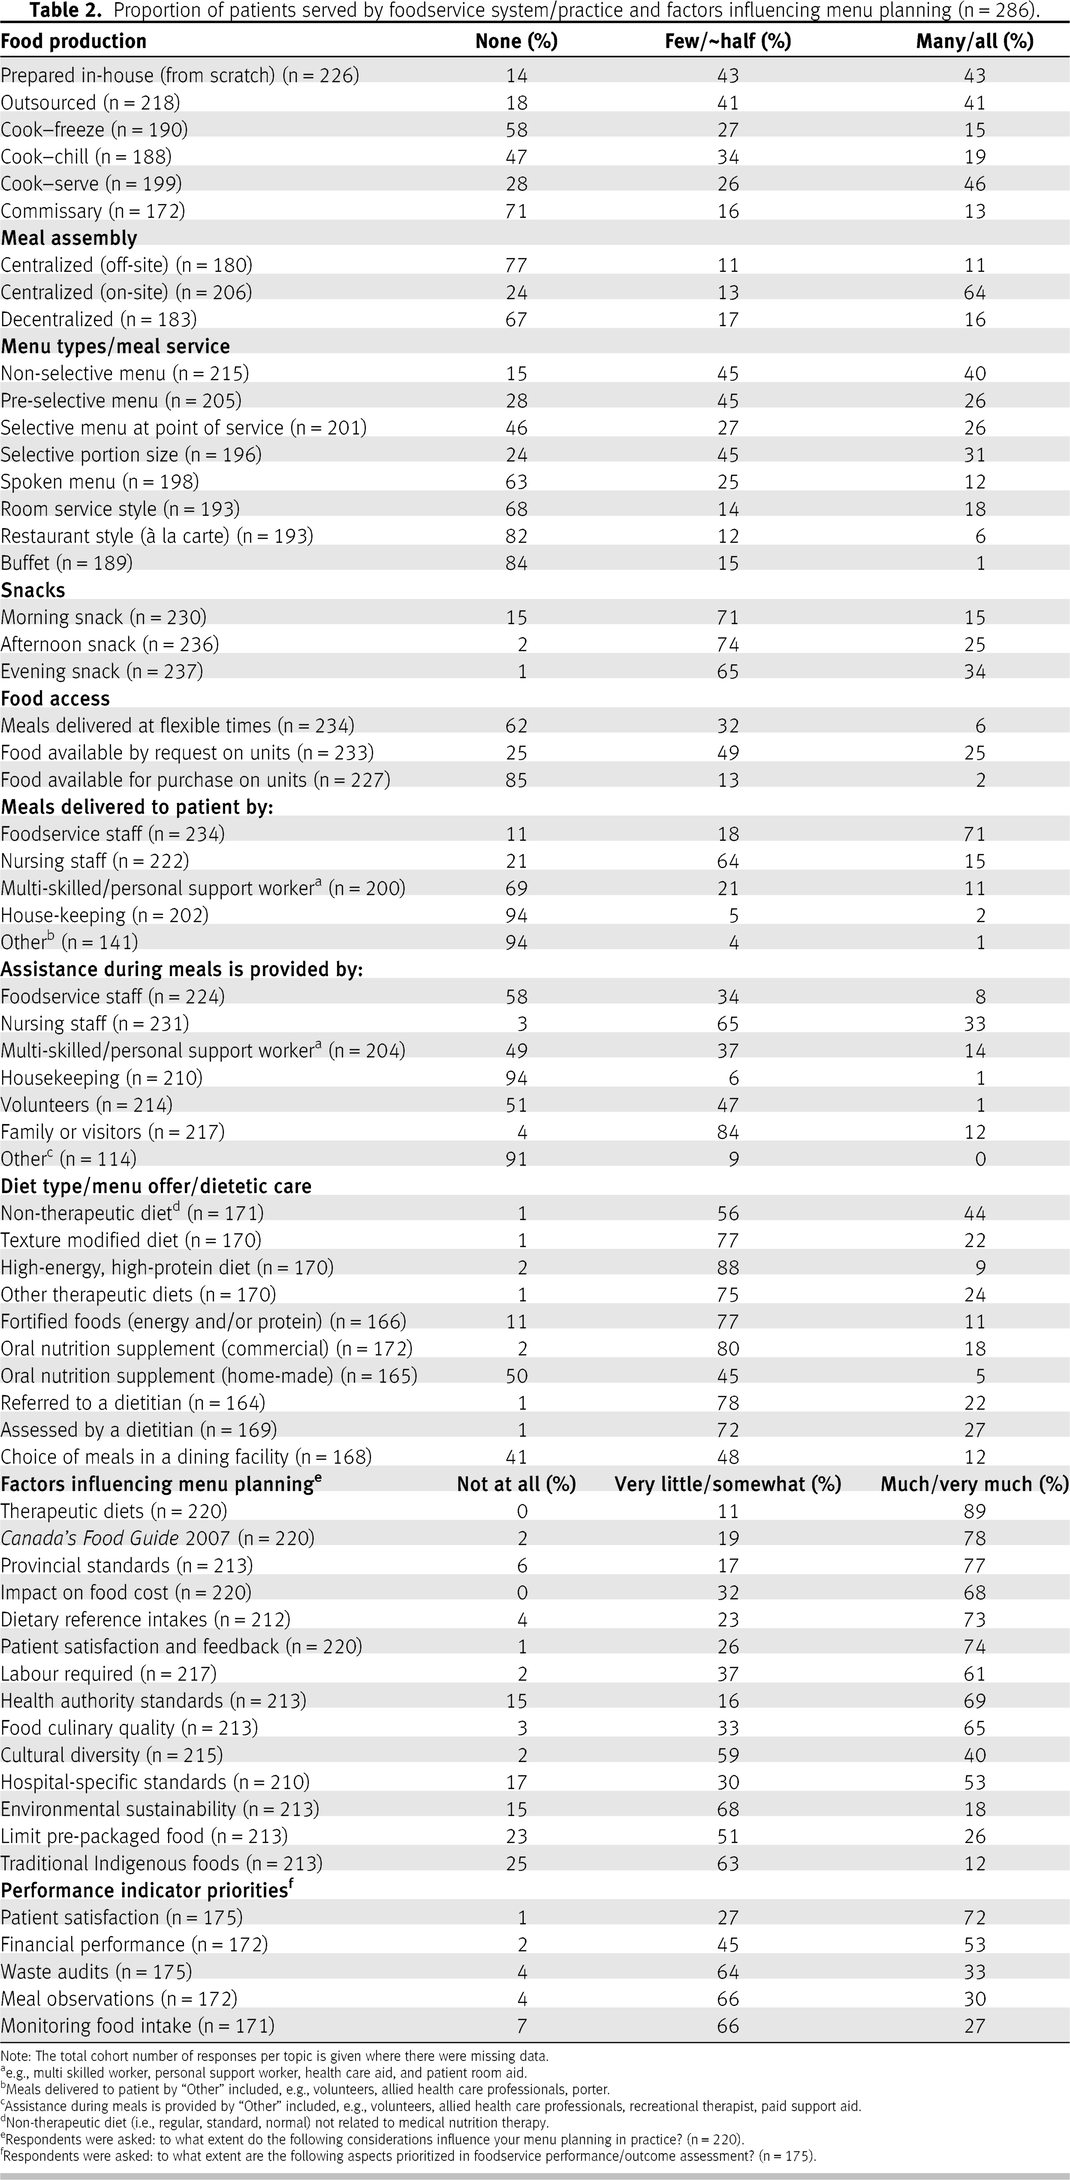
Foodservice systems were diverse with a split between pre-prepared and in-house production, mostly cook–serve food production and assembled at a central location (on-site) versus decentralised or off-site meal assembly (
Table 2). Non-selective menus were most common with limited opportunities for patient choice in advance or at point of service. Typically, hospitals offered snacks to few patients and flexible meal availability was generally not offered or only offered for few patients. The most common menu cycle length was 3 weeks for 57% (n = 79) of hospitals.
Meals were most commonly delivered to the patient by foodservice staff or by nursing staff when eating assistance was required, although practices varied. Adequate training was indicated to be higher for meal delivery than for assistance during meals at 55% (n = 125) versus 29% (n = 59), respectively. Additionally, only 3% stated that no training was provided for meal delivery, whereas 24% had no training on meal assistance. Restrictions on family/visitors bringing meals for patients from the outside were noted by 23% (n = 54) of respondents, e.g., must follow diet orders, disallowed for dysphagia, food safety, and proper food handling/storage. Furthermore, 58% (n = 134) of respondents reported restrictions on who could provide assistance with meals and feeding patients. Practices ranged from “only nursing provide assistance with meals” to “family and paid companions often provide assistance”. Allowance of assistance from volunteers or foodservice staff varied. Some sites required training and were more restrictive for dysphagia, whereas setting up trays and opening containers was typically less restricted.
Menu planning and outcome assessment
The top factors influencing menu planning were therapeutic diets and
Canada’s Food Guide 2007 (CFG), whereas the least influential factors included: Indigenous foods, limiting packaging, environmental sustainability, hospital-specific standards, and cultural diversity (
Table 2). The most common foodservice outcome assessment methods were patient satisfaction and financial performance, whereas waste audits, meal observations, and monitoring food intake were least common.
Diets
“Regular” was the term most commonly used (71%) for a non-therapeutic diet (n = 189) followed by “General” for 7% and “Standard” for 6%. When asked how this diet was defined (n = 151), 36% defined it by nutrient targets, 29% by CFG, 28% by provincial and/or regional standards, 18% by calorie targets, 9% by no standards/unrestricted, 7% by no texture modifications, 5% by Dietary Reference Intakes (DRIs), and 4% by preferences/personalized. Calorie targets ranged from 1200 kcal to 2400 kcal with 1800 kcal being most common for half of the respondents. Nutrient targets that were perceived as most important in descending order (n = 139) included: protein (32%), sodium (22%), calories (22%), fat (11%), fibre (6%), carbohydrate (6%), sugar (5%), all nutrients (4%), and water (2%). Additionally, regarding targets, some respondents viewed compliance with dietary guidelines and/or local nutrient standards (15%) as important, whereas diet liberalization (8%) and flexibility/choice (6%) were most significant for others. Targets that were viewed most flexible (i.e., able to liberalize) included: sodium (11%), fat (6%), carbohydrate (6%), and micronutrients (5%). A need to liberalize diets to optimize intake and reduce the risk of malnutrition was noted by some respondents.
The number of therapeutic diets (n = 158) ranged widely from 2 to 150 (median ± IQR 23.5 ± 39); 85% of respondents provided a number, whereas 10% stated that they had many or too many diets, 3% not applicable, and 2% didn’t know. When asked about the most commonly used therapeutic diet (excluding texture modified) (n = 171), a diabetes-related diet was the first most common according to 63%, whereas only 3% for a high-energy, high-protein diet. The second most common therapeutic diets used (n = 169) were a cardiac-related diet, diabetes diet, and low-sodium diet according to 33%, 20% and 18%, respectively, compared to 4% for a high-energy, high-protein diet. The third most common therapeutic diet (n = 165) was a renal-related diet according to 24% and 7% for a high-energy, high-protein diet. The terms used and types of therapeutic diets varied considerably.
In descending order of frequency, respondents (n = 180) reported that diets were ordered by physicians 94%, dietitians 91%, nurses 60%, nurse practitioners 21%, occupational therapists 22%, speech language pathologists 12%, diet technicians 9%, and unit clerks 0.6%. Comments were made that the level of access to diet ordering varied per professional groups, e.g., initial diet order is restricted to physician or nurse practitioner, whereas nurse, dietitian, and speech language pathologist can modify the order; physician must sign-off diet orders; and speech language pathologist/occupational therapists can only order dysphagia diets. The level of understanding about diets by those who order (n = 178) was rated as very good/good 50%, average 37%, and poor/very poor 13%. Comments made on communication about diets to staff responsible for ordering (n = 141) identified challenges and need for training of select staff on types and ordering of diets. Although level of understanding of diets was rated mostly positively, disparity in understanding between staff groups was reported.
Nutrition care and foodservice practices to prevent malnutrition
Supplementary File 21 provides an overview of nutrition care, meals, diets, and foodservice practices to prevent malnutrition including several illustrative quotes. Thirty-nine percent of respondents reported that patients are screened for nutrition risk and 27% were not aware of screening. Fifty-five percent of respondents had “culinary standards (e.g., menu planning, food quality or food plating standards)”, although related practices were highly variable. Presence of foodservice initiatives for patients at risk of malnutrition were reported by 51% of respondents, with 66% of respondents reporting having diet office software packages available, 56% having a high-energy, high-protein diet for patients at risk of malnutrition, 49% noting practices for fortified foods/beverages, and 34% having medication pass (Med Pass) nutrition supplement programs. Fifty-four percent of respondents used patient satisfaction/experience tools to obtain feedback, although frequency and methods varied widely. Additionally, qualitative analysis of perceived barriers, enablers, and optimal foodservices found similar themes among questions, e.g., adequate budgets and staffing, flexible patient-centered foodservice, quality food produced in-house, liberalized diets, improved food access and support at meals, prioritization of food in hospital, and skilled, engaged workers to support effective nutrition care collaborations. However, diversity of answers appeared to also be a reflection of diversity in existing foodservice systems and practices among sites (
Supplementary File 21).
DISCUSSION
This study is the most comprehensive to our knowledge of Canadian hospital foodservice. Another study on food and nutritional care in hospitals in 12 European countries in 1999 [
15,
16] identified similar barriers, e.g., negative views of hospital food; lack of awareness of the problem of malnutrition; inadequate education, collaboration, and defined responsibilities among staff groups; lack of patient-centered menus and meal service allowing for choice and flexibility; and lack of prioritization of foodservices as an important part of therapeutic care. Consistent with our findings, this study [
15] also found suboptimal practices of only offering 3 meals, no snacks at specific times and the “general menu” was most common, whereas energy- and protein-dense menus were available, but not widespread. In response to these observations, the Council of Europe adopted a resolution in 2003 [
6], which acknowledges the problem of malnutrition in hospital, declares access to food in hospital as a fundamental human right [
11], and provides approximately 100 evidence-based recommendations for food and nutrition care in hospital.
The resolution recommends nutrition-risk screening as an essential first step of nutrition care in all hospitalized patients [
6], which is consistent with the Canadian Integrated Nutrition Pathway for Acute Care [
12]. Contrary to this, only about a third of the survey respondents in the current study confirmed that patients were being screened for risk of malnutrition at admission, although about a quarter were not aware whether screening was done and of those that answered yes, a third didn’t know which tool was used. This apparent lack of awareness of nutrition care practice by foodservice managers is perhaps not surprising since risk status was typically not considered in diet ordering and about 40% of sites did not have a reporting structure combined with clinical nutrition services.
Another recommendation of the Council of Europe resolution is to develop national standards for hospital food provision to prevent malnutrition [
6] and many countries have such standards [
7–
10]. Canada lacks national standards for hospital foodservice and a comprehensive review of food procurement and nutrition standards in public facilities recommended that: “given that meals are medically necessary hospital services under the Canadian Health Act, re-classify nutrition and foodservices from operations (cost focus) to patient care (health focus)” [
17]. This recommendation is consistent with survey responses regarding the negative culture and attitudes towards hospital food as a support service instead of an essential part of care.
Any regional Canadian recommendations for hospital food are typically consistent with dietary recommendations for population health (e.g., limiting salt, fat, and sugar content of menus) [
17]. This lack of focus on patients at risk of malnutrition is demonstrated in survey responses, e.g., CFG is a second most important factor influencing menu planning. Therapeutic diets were the top factor impacting menu planning, which is disconcerting considering that diabetes and cardiac diets were the most common therapeutic diets whilst high-energy, high-protein diets were less common in light of evidence supporting liberalized diets to promote adequate intake [
18–
21] and the association of restrictive therapeutic diets with increased risk for malnutrition [
22].
In contrast to these Canadian findings, UK hospital food standards [
7] have a different approach, which differentiates between “eating for health” in individuals at risk of malnutrition (i.e., high-energy, nutritionally dense food/drink) versus “healthy eating” to promote health in those not at risk (i.e., Eatwell Guide [
23]) and promote a “patient-focused food and drink strategy”. This UK strategy has been supported by various initiatives, such as the Better Hospital Food Project [
24] and Protected Mealtimes [
25], aimed at improving patient food intake. Additionally, consistent with our observations that insufficient budgets were the most common perceived barrier to optimal foodservices, UK standards were deemed less effective when voluntary and/or not backed by adequate funding [
26].
Prioritization of foodservice in health care as medicine has been identified as a lesson for Canada to learn from Denmark [
27]. This has resulted in positive changes in foodservice practices as demonstrated by a Danish study [
28] comparing practice from 1995 to 2003. This study found a decrease in centralized production (from 99% to 80%), increase in satellite kitchens (from 1% to 20%), decentralized plating or buffets (from 31% to 65%), more educated cooks/catering assistance (from 29% to 51%), and fewer unskilled workers (from 45% to 25%) allowing for point of service, personalized portion sizes, and higher-quality food produced in-house. These changes in practice are consistent with the survey themes on optimal foodservices of the current study, i.e., patient-centered, flexible, and allow for choice of quality food produced in-house by skilled staff. Another Danish study found that providing education and delegating responsibility to health care assistants for patient-centered nutrition care, such as ordering personalized food for nutrition risk patients, resulted in a decrease in food waste from 55% to 18% [
29].
Study limitations
Survey responses were self-reported by foodservice/nutrition managers and might be limited by respondents’ lack of knowledge of certain aspects of their practice, e.g., clinical nutrition care on units. Responses from other stakeholders, such as clinical dietitians, nurses, physicians, managers, patients etc., might have elicited more diverse and comprehensive perspectives. The survey was somewhat long and complex in parts, which might have impacted respondent fatigue as is evident from decreasing response rate over the course of the survey. Complexity of survey responses was especially challenging for the 20% of respondents answering in relation to multiple sites, whereas responses from Alberta were more homogenous since background information for the survey was shared with colleagues throughout the province. Also, results might not be generalizable to all areas of Canada, especially underrepresented provinces/territories in northern/eastern Canada. Further research is needed to assess different types of hospitals and foodservice systems and association with patient satisfaction, health, and financial outcomes. Despite these limitations, the survey responses were representative of all regions across Canada and provide a comprehensive overview of current hospital foodservice practices relevant to address malnutrition in hospital.


