INTRODUCTION
In 2017, the Government of Canada reported that 30% of children between the ages of 5 and 17 years were overweight or obese [
1]. Childhood obesity rates have tripled in the last 30 years [
1]. Being overweight or obese can increase the risk of chronic disease development, increase healthcare costs, and decrease quality of life [
2]. Thus, a multipronged approach for a complex issue such as childhood obesity is needed to establish effective interventions for prevention. The World Health Organization (WHO) recommends limiting free sugar intake, as excessive consumption remains a public health concern in several countries [
3]. Dietary sugar intake above the WHO guidelines of no more than 5% and 10% of total caloric intake from free sugars may increase risk of obesity and dental caries [
3,
4]. Excessive sugar intake can also impact diet quality and lead to nutritional inadequacies [
3]. Early life interventions such as limiting free and added sugar intakes in preschool-aged children can contribute to reducing the risk of obesity and chronic disease as well as dental caries later in life [
4].
Dietary sugar intake in children can be influenced by many factors including genetics, maternal, and cultural factors as well as by food supply availability and globalization [
5,
6]. Examining sugar intake patterns of young children is critical as dietary patterns become established at a young age and can extend into adulthood [
7]. Furthermore, overconsumption of sugar intake in early childhood can lead to the intake of “empty” calories leading to weight gain and displacement of nutrient-dense foods associated with high sugar intake [
8]. Excessive free and added sugar intakes may also predispose children to the development of non-alcoholic fatty liver disease and cardiometabolic risk markers such as increases in triglycerides, systolic blood pressure, insulin, cholesterol, abdominal fat, and C-reactive protein [
9–
11]. Moreover, added sugars (processed) are present in large quantities in packaged foods in the Canadian food supply [
12].
Several gaps and limitations exist in the literature on sugar intake, including limited research studies in young children in the Canadian context along with differing study methodologies, definitions of sugar, and underreporting of food intake [
13,
14]. Many studies have found positive associations between sugar intake and body weight while others have found no significant association [
13,
4]. The gaps could be attributed to the limitations of cross-sectional studies and compounded by the fact that most studies have focused on sugar-sweetened beverages (SSB) [
15,
16], which have consistently been demonstrated to cause weight gain in children and adolescents (aged 2–16 years) [
6]. Contrary to above, a systematic review has indicated that randomized controlled trials (in children) aimed to limit sugar intake have not led to significant changes in body weight [
17]. These contradictory results from different studies make it important to investigate longitudinal associations between dietary sugar intake and anthropometric measures.
A cross-sectional research study from the Guelph Family Health Study (GFHS) has previously identified that 80% of the 109 enrolled preschool-aged children exceeded the 5% free sugar recommendation and 32% exceeded the 10% free sugar intake limits set by the WHO [
16]. Further analysis demonstrated a weak inverse but statistically significant cross-sectional association between energy-adjusted free sugar intake and waist circumference (WC) [
16]. The primary objective of the current study was to extend these findings by examining longitudinal associations between baseline intakes of total, free and added sugars, and anthropometric measures (body weight, BMI Z-scores, percent fat mass, and WC) at 18 months among young children (aged 1.5 to <8 years) in the GFHS pilot studies.
RESULTS
Participants were included in the analytic sample if they had a complete 3-day food record and if breastfeeding did not replace a meal. Thus, of the 117 participants (from 83 families), 109 children (55 females, 54 males) from 77 families were included in the final analytic sample as seen in
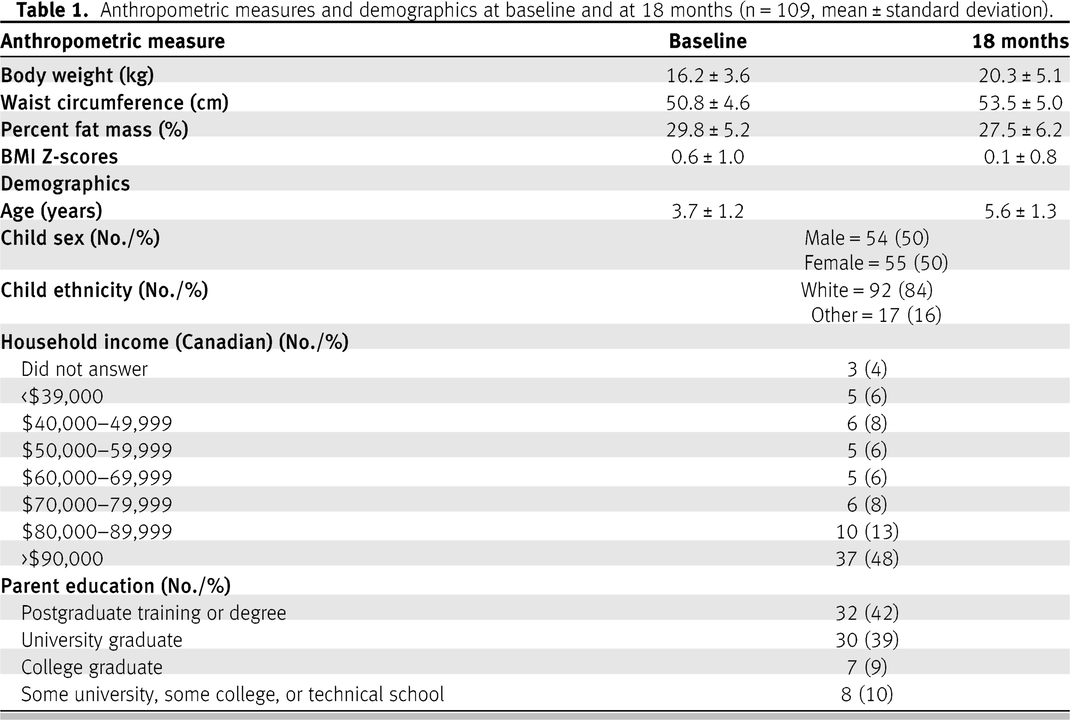
Figure 1. The average age at baseline was 3.7 ± 1.2 (SD) years and 5.59 ± 1.3 years at 18 months. The majority (84%) of participants identified as White; 48% of the families had an annual household income greater than $90,000 and 42% of the one of the parents had a postgraduate education. This has also been described in
Table 1 of this study and elsewhere in detail [
17]. Baseline weight measures were available for 106 children. Among these children, 69% (n = 73) were classified as normal or underweight (BMI Z-scores <1) and 31% (n = 33) as overweight (BMI Z-scores >1).
At 18 months follow-up, there were missing data for body weight measures and BMI Z-scores for 24 participants (22%), WC for 23 participants (21%), and percent fat mass for 25 participants (23%), for a final analytic sample of 84–86 participants (depending on the variable). Participants with missing data were not significantly different from those with complete data with respect to age, sex, and household income.
Sugar intake and anthropometric measures
Sugar intakes at baseline (mean (g) ± SD/day) was 86 ± 26 (21.5 teaspoons) for total sugars, 31 ± 15 (7.75 teaspoons) for free sugars, and 26 ± 13 (6.5 teaspoons) for added sugars [
17]. Anthropometric values are presented in
Table 1.
Longitudinal associations between sugar intakes and anthropometric measures
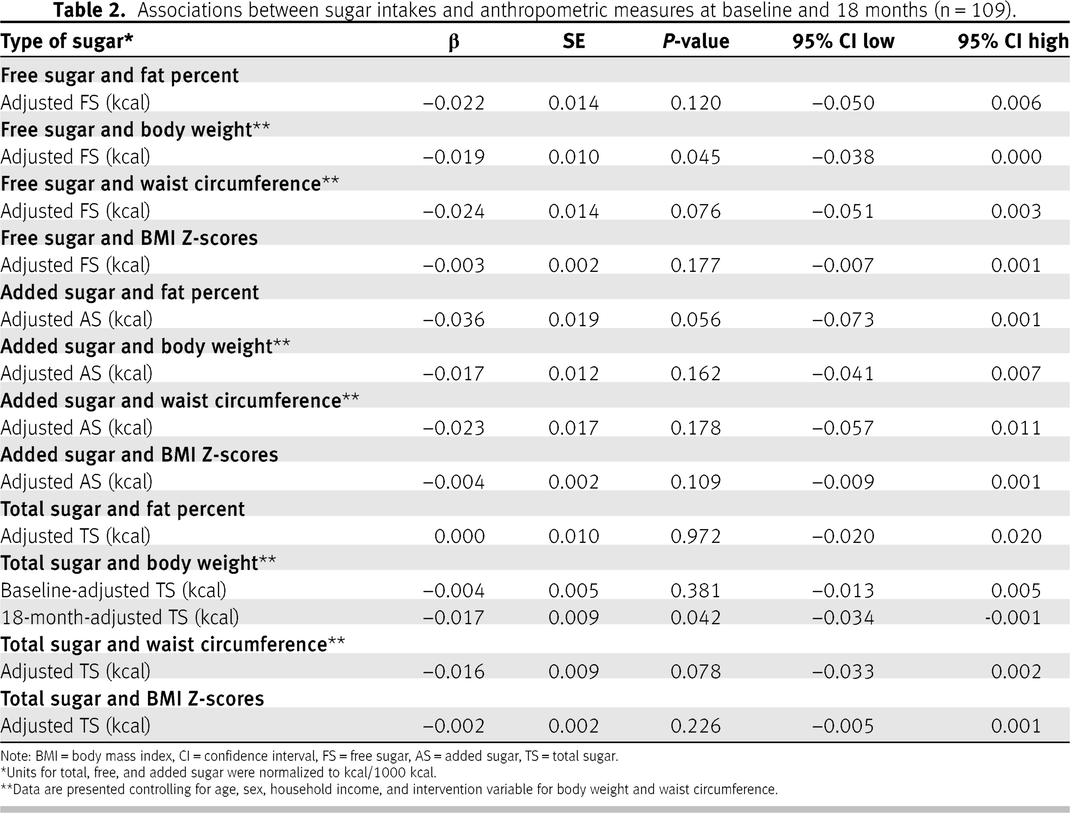
There were no significant associations between sugar intake at baseline and at 18 months for total, free, and added sugar intakes and body weight, WC, BMI Z-scores, and percent fat mass, except for the association between total sugar and body weight (interaction
P = 0.01). For every kcal increase in total sugar at baseline, there was a decrease in body weight at 18 months of 0.017 kg (
P = 0.04; 95% CI = −0.03 to −0.001). Overall associations are reported in
Table 2 in addition to the time-dependent (baseline and 18 months) associations for total sugar and weight. The data were further stratified by sex and baseline weight status to examine the potential role of subgroups; however, results did not differ from the initial analyses (data not shown).
DISCUSSION
This study examined longitudinal associations between dietary intakes of total, free, and added sugar at baseline with anthropometric measures (percent fat mass, weight, WC, and BMI Z-scores) at baseline and 18 months for children between the ages of 1.5 and <8 years. Except for a small but statistically significant inverse association between total sugar intake at baseline and body weight at 18 months, we did not find any significant associations between total, free, and added sugar intakes and anthropometric measures at either baseline or 18 months in young children.
There may be varied reasons for the absence of associations between total, free, and added sugars and anthropometric measures including body weight, WC, percent fat mass, and BMI Z-scores. At this young age and period of rapid growth, dietary patterns differing in macronutrient composition may have varied influence on growth. Thus, these findings highlight the challenge of discerning the specific contribution of sugar on anthropometric outcomes in tandem with this rapid growth phase. Similar to our study, other research has found no significant associations between dietary sugar intake and anthropometric measures in children. For instance, a cross-sectional data analysis of the National Health and Nutrition Examination Survey (NHANES) (1971–1975; 1988–1994) enrolled children (n = 20,000) aged 1–18 years and found no significant associations between total and added sugar intakes and BMI [
26]. This study determined that total energy intake had the greatest impact on children’s BMI [
26]. Also, the NHANES data from 1999 to 2002 for children aged 2–5 years (n = 1160) did not find any association between BMI and SSB intake [
27]. Another study in 1345 children in the North Dakota Special Supplemental Nutrition Program for Women, Infants, and Children group found no significant association between SSB consumption and changes in weight and BMI at 6 months and 12 months follow-up [
28]. The lack of significant associations in these studies could be due to differing anthropometry methodology and/or use of self-reported dietary data. In addition, it may be that parents of children who are overweight and obese may restrict their children’s intake of sugar as reported in other research studies [
29,
30]. Thus, there is the potential for reverse causation. Further long-term studies that address these methodological shortcomings are needed.
In contrast to the results in the aforementioned studies, there is a concern that consumption of sugar above the WHO guidelines can contribute to increased body weight and BMI in young children. A cross-sectional study investigated associations between SSB (specifically packaged juices, including fruit drinks and fruit juices, and soft drinks) intake and weight in obese children (n = 1823) aged 4–5 years [
31]. This study found a high prevalence of obesity ranging from 5.9% to 9.3% within the study cohort that was mostly mediated by the intake of packaged juices (
P = 0.03) [
31]. Children who consumed >1 serving (1 serving = 175 mL/6fl oz) of SSB (both packaged juices and soft drinks) per day had a significantly higher prevalence of obesity (OR = 3.23%; 95% CI 1.48–6.98) [
27].
Most of the longitudinal research on dietary sugar intake has focused on SSB as the main source of free and added sugar for young children. A longitudinal study conducted in Québec, Canada found that children between the ages of 2.5 and 3.5 years (n = 2,103) consuming more SSB were at higher risk of being overweight at 4.5 years [
32]. Another longitudinal study from the United States examined intake of SSB of children (n = 1189) from infancy to 6 years in relation to the prevalence of obesity in these children with advancing age [
33]. This study found that infants exposed to SSB were twice as likely to be obese at 6 years of age when compared with infants who were not exposed to SSB [
33]. It was also noted that the likelihood of consuming SSB at age 6 years was 71% higher for those children with any consumption of SSBs and 92% higher for SSB intake before 6 months of age [
33]. Added sugars from baked goods, sweets and spreads, and sweetened dairy products consumed in excess in the first 2 years of life were associated with an increased BMI at age 7 years in a subset of the longitudinal Dortmund Nutritional and Anthropometric Longitudinally Designed study (n = 216; 111 boys and 105 girls) [
34]. Similar results were seen in the Early Childhood Longitudinal Birth-Cohort study, where SSB intake in children aged 2–5 years was examined [
35]. This study showed that children with a higher BMI Z-score at age 4 or 5 years, but not at 2 years, had increased SSB intake [
35]. Another study by Lim and colleagues, of low-income Black preschool-aged children (n = 365) between the ages of 3–5 years, suggested that increased SSB intake was linked to higher odds of being overweight over 2 years [
36]. Thus, these studies suggest that there is a link between added sugars and SSB intake in early childhood with an increase in weight and BMI in later childhood.
Considered together, these cross-sectional and longitudinal studies demonstrate inconsistent findings in this research area, likely due to the young age of children who are still growing. Nevertheless, longitudinal studies suggest an association between sugar intake and anthropometric outcomes, thus highlighting the need for longer multiyear follow-up.
Study strengths and limitations
Although this study is novel and adds to the limited longitudinal research studies on dietary sugar intake in young children, certain strengths and limitations should be considered. Sugar intake and weight status of the children in the present study are comparable to other Canadian studies [
17,
37,
38]. However, the study results may not be generalizable to diverse and low socioeconomic populations. Parent-reported food records may have underreporting errors along with social desirability bias. This was also a small study; thus, further replication is needed in a larger cohort. We did not adjust for physical activity; this may be a limitation as physical activity may counteract the sugar impact on body weight. Sugar intake in this study was manually inspected and calculated using the algorithm of Louie and colleagues [
19] due to limitations of nutritional databases. This adds confidence in our measures of sugar intake.


