Open access

The Cost of a Nutritious Diet for Households Including People Living with HIV/AIDS in Nova Scotia: Findings and Lessons Learned by FoodNOW 2020 to 2022

Publication: Canadian Journal of Dietetic Practice and Research
6 March 2023

Abstract

Purpose: FoodNOW (Food to eNhance Our Wellness) engaged in assessment of simulated households that include a person living with HIV/AIDS (PLWHA) in Nova Scotia to determine if a basic nutritious diet is affordable.
Methods: We used supermarket websites to cost food and beverage items listed in the National Nutritious Food Basket (NNFB) for simulated households, each with a PLWHA. Food costing methodologies were co-developed and adapted with community members in response to barriers presented by the COVID-19 pandemic.
Results: We found that simulated households, each with one PLWHA, that had a potential deficit after monthly expenses were a household of four on Income Assistance (−$1,058.70), a lone mother with two children on Income Assistance (−$973.65), a lone man on Income Assistance (−$677.40), and a household of four with one minimum-wage earner (−$383.45).
Conclusions: Nova Scotia households with a PLWHA living on Income Assistance or with a minimum-wage earner cannot reasonably afford a nutritious diet in addition to basic household expenses. Using these food costing data can allow dietitians to efficiently inform government action and policy change to improve the health and wellness of individuals and families.

Résumé

Objectif. FoodNOW (Food to eNhance Our Wellness [Les aliments pour améliorer notre bien-être]) a évalué des ménages simulés incluant une personne vivant avec le VIH/SIDA (PVAVS) en Nouvelle-Écosse afin de déterminer si une alimentation nutritive de base est abordable.
Méthodes. Nous avons consulté les sites Web de supermarchés afin de calculer le coût des aliments et des boissons figurant dans le Panier de provisions nutritif – Canada (PPNC) pour les ménages simulés, chacun incluant une PVAVS. Les méthodologies de calcul du coût des aliments ont été élaborées conjointement et adaptées avec des membres de la communauté en réponse aux obstacles qu’a entraînés la pandémie de COVID-19.
Résultats. Nous avons constaté que les ménages simulés, chacun incluant une PVAVS, qui avaient un déficit potentiel après les dépenses mensuelles étaient les suivants : un ménage de quatre personnes bénéficiant de l’aide au revenu (−1 058,70 $), une mère monoparentale avec deux enfants bénéficiant de l’aide au revenu (−973,65 $), un homme seul bénéficiant de l’aide au revenu (−677,40 $) et un ménage de quatre personnes avec un travailleur au salaire minimum (−383,45 $).
Conclusions. Les ménages de la Nouvelle-Écosse comprenant une PVAVS qui reçoivent une aide au revenu ou dont une personne travaille au salaire minimum ne peuvent pas raisonnablement se permettre d’avoir une alimentation nutritive en plus des dépenses de base du ménage. L’utilisation de ces données sur le coût des aliments pourrait permettre aux diététistes d’orienter efficacement les mesures gouvernementales et les changements de politiques afin d’améliorer la santé et le bien-être des personnes et des familles.

INTRODUCTION

Food insecurity in Nova Scotia

The province of Nova Scotia has historically reported the highest rates of household food insecurity of all Canadian provinces [1]. Food security as defined by the United Nations’ World Food Summit is “when all people, at all times, have physical and economic access to sufficient, safe, and nutritious food to meet their dietary needs and food preferences for an active and healthy life” [2], whereas household food insecurity is understood as the “inadequate or insecure access to food because of financial constraints” (p. 3) [1], as reflected in how it is measured in Canada. In 2019, it was reported that the prevalence of households experiencing food insecurity in Nova Scotia was 18.8%, the highest rate of all provinces [3]. Researchers have reported a strong correlation between household food insecurity and negative health outcomes [4], such as poor mental health [5], chronic pain [6], diabetes [7], and premature death from infections and other health complications [4].
Given the high rates of household food insecurity in Nova Scotia [1, 3], the impact of the current cost of living for households receiving Income Assistance, minimum wage, or with precarious employment and including a person living with HIV/AIDS (PLWHA) should be assessed. Evidence within health literature supports that the health and well-being of a PLWHA is directly impacted by household food insecurity [8] and poverty [9]. In 2018, the Government of Canada established the costs of the Market Basket Measure (MBM) as Canada’s poverty line. The MBM is defined as a basket of the goods and services, such as food, clothing, and transportation, that reflects a modest and basic standard of living for a four-person household [10]. In fact, food insecurity and its most important determinant, poverty, are among the numerous systemic barriers to nutritional needs that a PLWHA experiences [9]. Optimal nutrition in congruence with medication therapies is critical to the overall health and well-being of a PLWHA in maintaining their immune system and preventing disease progression [9, 11]. Food costing methodology allows researchers to create economic simulations that replicate possible individual and household scenarios, an approach to surveying commonly used by several disciplines (e.g., forecasting climate change outcomes, profiling consumer behaviours) [12].

COVID-19 pandemic and food insecurity in Canada

The first wave of the COVID-19 pandemic started in Canada in early 2020. During this time, provincial public health measures across Canada were implemented. Between February and April 2020, the Canadian workforce experienced a 15% decline in employment [13]. Nearly half of these job losses occurred primarily in the bottom earnings quartile and affected over 1 million Canadians [13, 14]. By May 2020, one in seven Canadian households were estimated to be experiencing food insecurity, a statistic reported to be underestimated [15]. Prior to the COVID-19 pandemic, the majority of those in food insecure households, but not all, were employed. Approximately 35% of food insecure households reported that their main source of income was from employment insurance, social assistance, or seniors’ income, rather than salary/wages [1]. In April 2021, the third wave of the COVID-19 pandemic occurred in Nova Scotia, which led to a government-mandated lockdown across the province, forcing all essential services, including grocery stores and food services, to operate at as low as 25% capacity [16]. As of June 2021, the unemployment rate in Nova Scotia was approximately 1.2% higher than the national average [17]. During the mandated lockdowns, grocery store visits lessened due to the perceived health risks of shopping in-store, store operating hours were reduced, wait times increased for entering the store, and public transportation operations were reduced [15]. As a result, 43% of Canadians have shopped less in-store for groceries during the pandemic [18].

Food to eNhance Our (collective) Wellness

Various stakeholders, including community members and HIV service organizations, were consulted in the development of this project as part of an integrated knowledge translation approach [19]. These stakeholders indicated that food insecurity and poverty were major concerns for a PLWHA. This project is part of the second phase of a four-phase, provincially funded research study called FoodNOW (Food to eNhance Our Wellness), which is centred on nutritional assessment of people, families, and communities living with HIV/AIDS in Nova Scotia. As such, FoodNOW recognizes that infectious disease wellness translates to everyone’s wellness. The purpose of this research was to assess the affordability of the National Nutritious Food Basket (NNFB) in relation to other basic expenses for households with a PLWHA in Nova Scotia. The NNFB represents a basic nutritious diet, which consists of a variety of foods that best reflect Canada’s Food Guide recommendations while also considering food items that are commonly consumed by Canadians [20].

METHODS

Study context

Over the past two decades, food costing in Nova Scotia has been undertaken using participatory food costing (PFC) methods, developed by the Food Action Research Centre (FoodARC) and partners [21], which includes community involvement at all stages. With a participatory approach, trained community members would collect food costing data themselves. PFC is used for monitoring the cost of a basic nutritious diet, examining social and economic policies impacting food security, and advocating for and informing policy change [21]. PFC was last conducted in Nova Scotia in 2015 using the NNFB tool [20] to calculate the cost of a basic nutritious diet for different age and gender groups, including pregnancy and lactation with the last economic simulations [21] published prior to the COVID-19 pandemic. Since the onset of the pandemic in March 2020, households in Canada have been experiencing increased rates of unemployment and food insecurity [13, 14, 22], indicating that now is an important time to engage in food costing to better understand the current food security climate and how related policies may be addressed with these data in mind.

Food costing

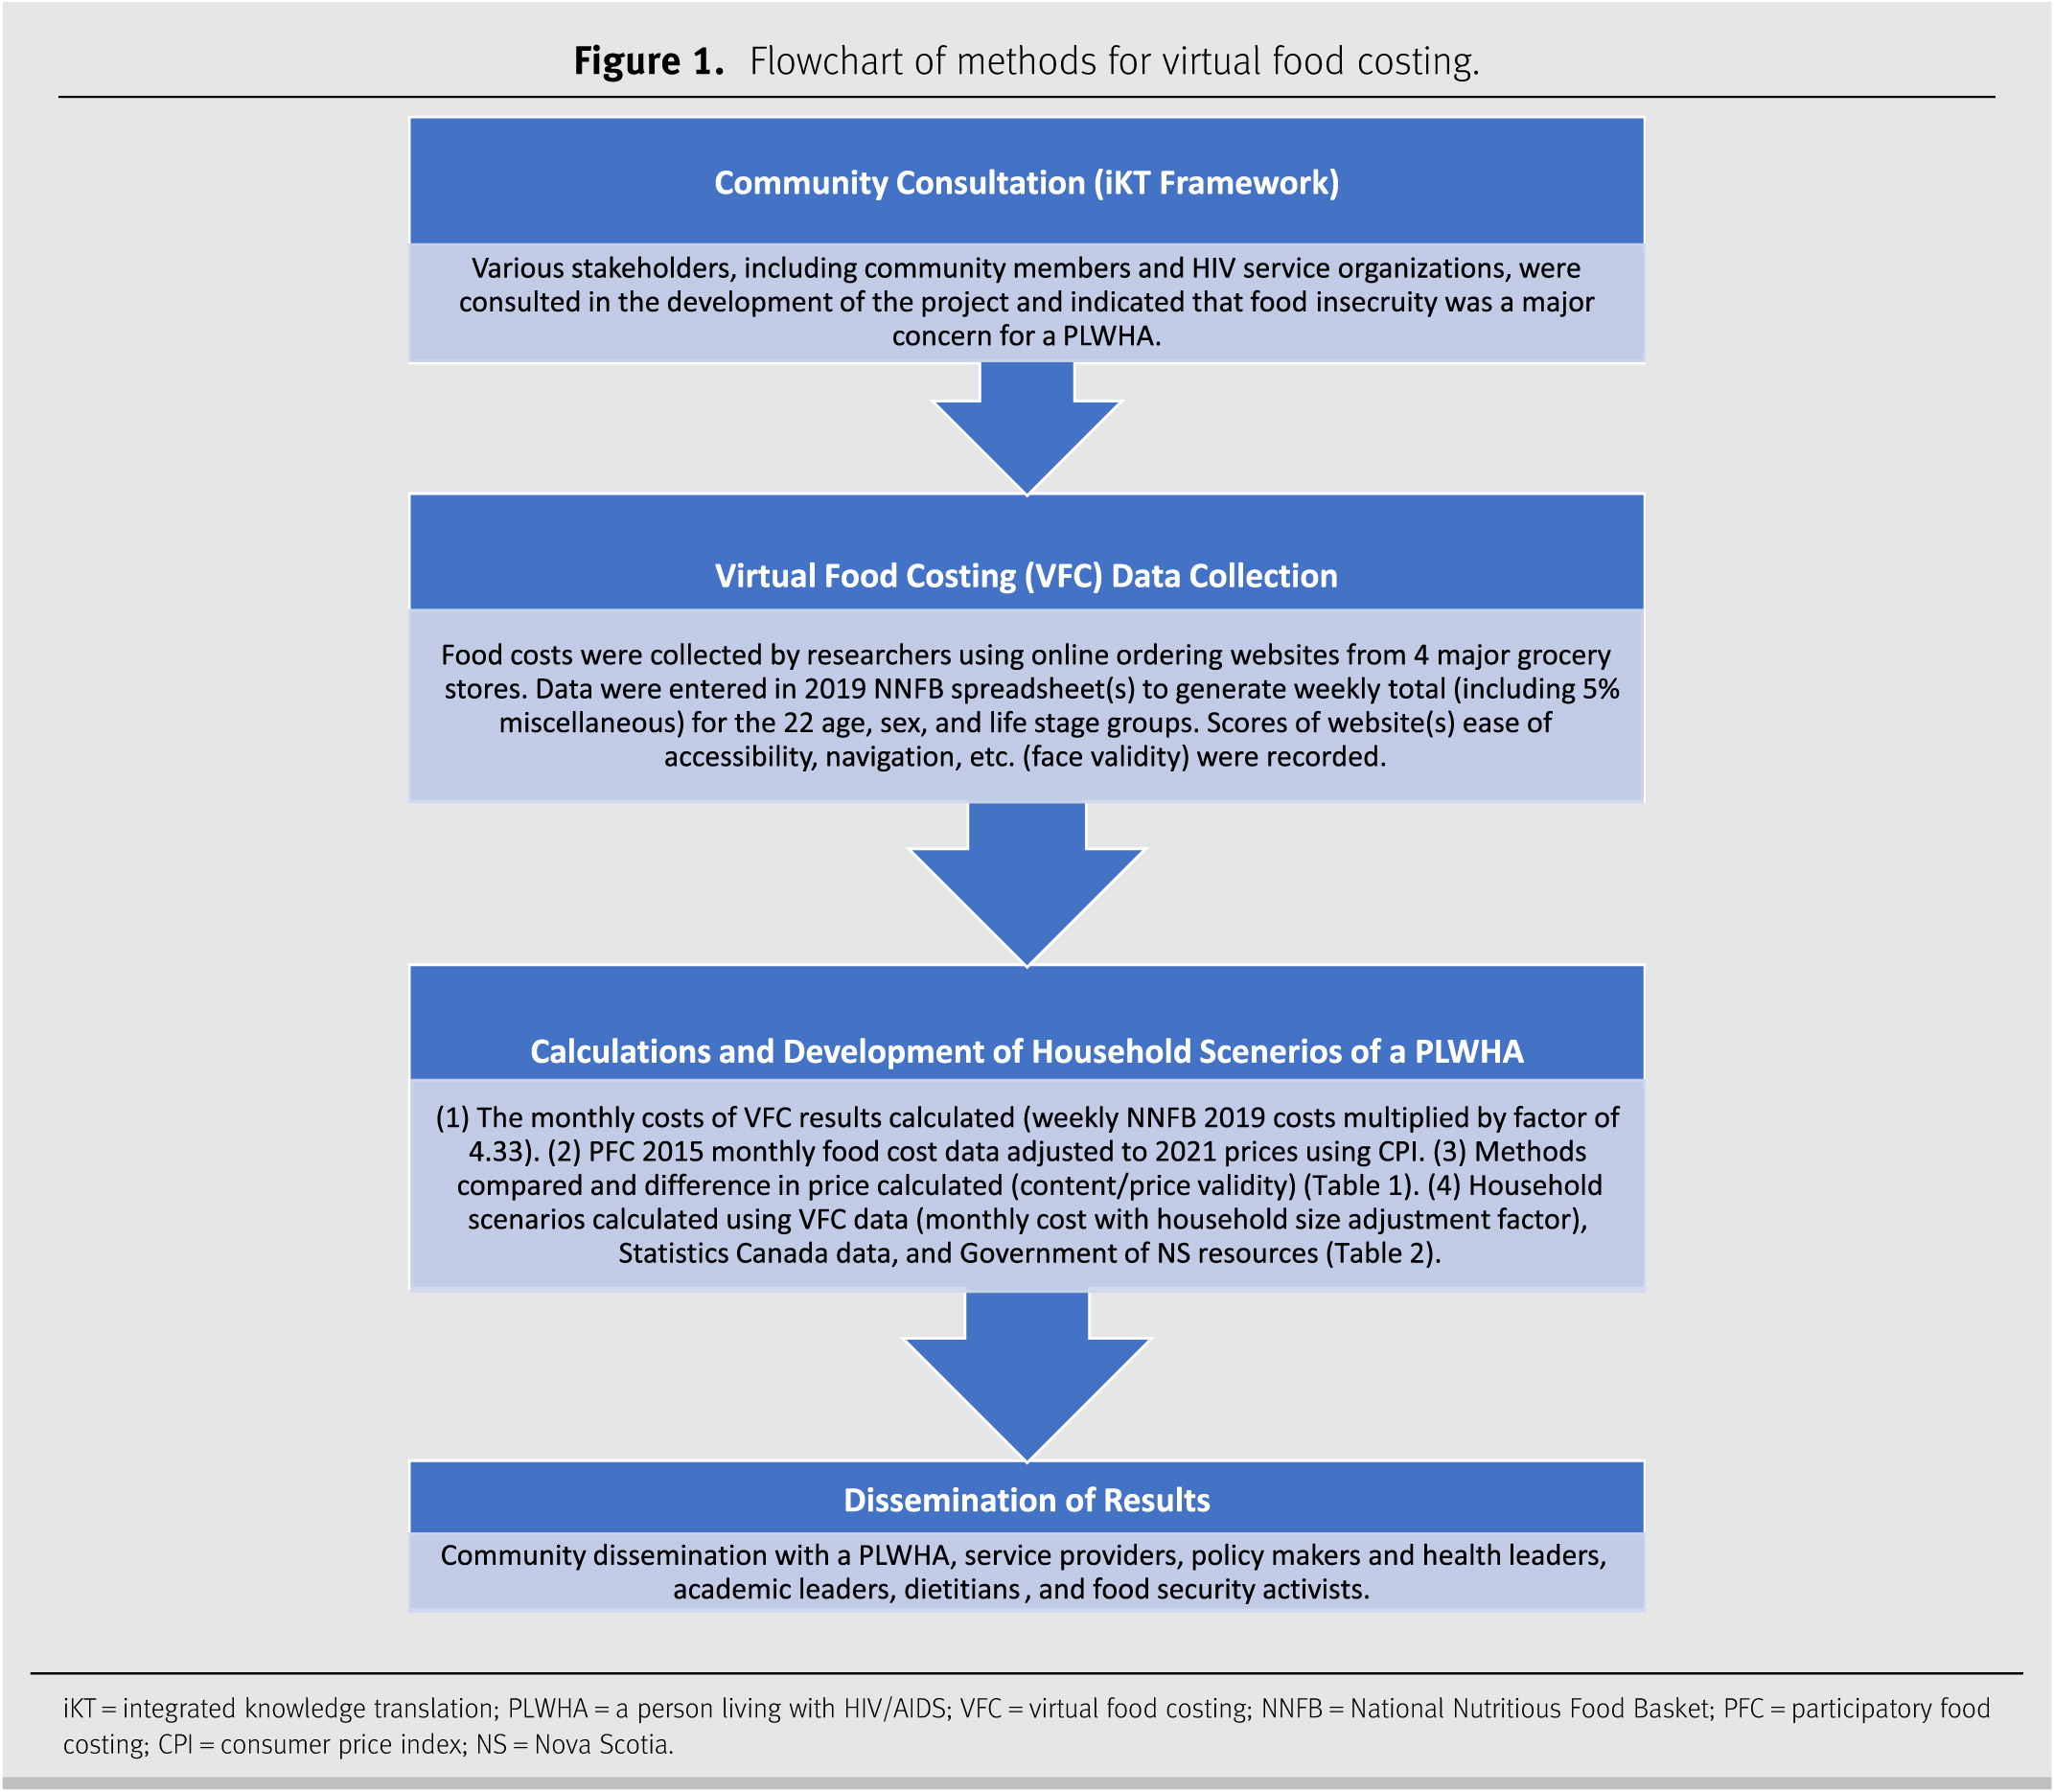
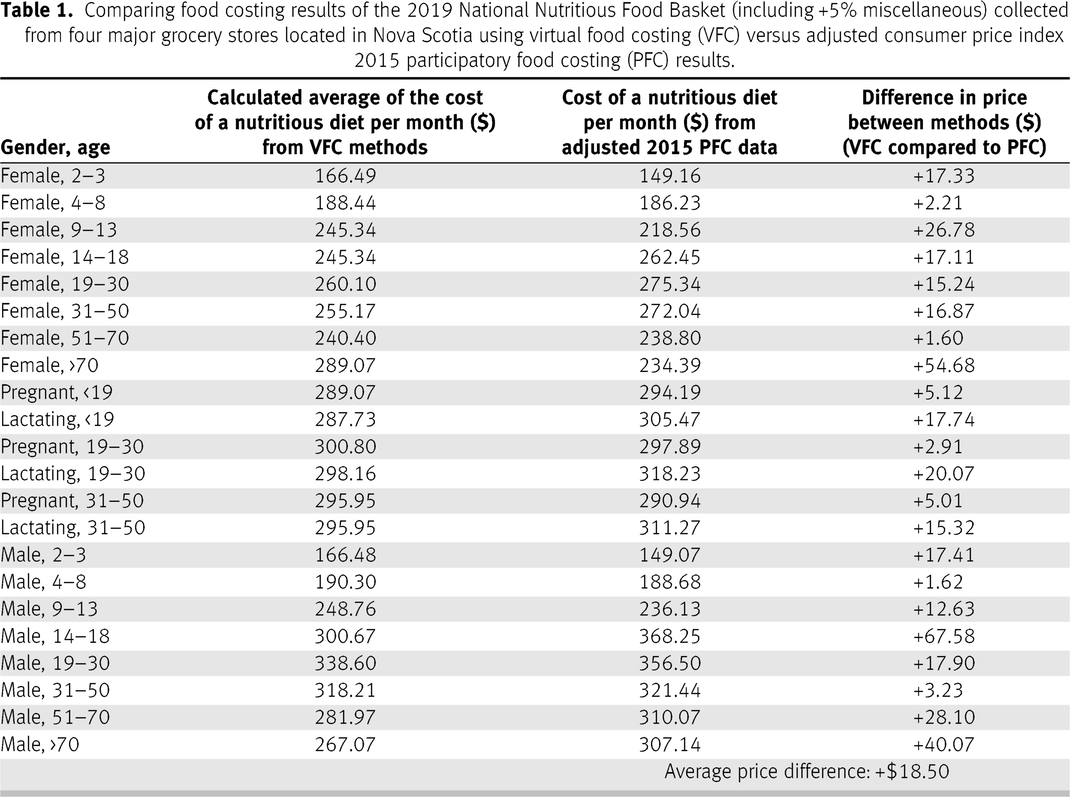
Virtual food costing (VFC) was developed as an alternative food costing method (Figure 1) during the COVID-19 pandemic in response to restrictions to in-person grocery shopping/food costing, as it was considered a safer option for both researchers and immunocompromised community members. Unlike in-person PFC, VFC was conducted exclusively online, and given that VFC is a novel method, the research team decided to conduct the data collection themselves. This means our study was not participatory as initially intended but, rather, community-based, as stakeholders and community members asked for this project and offered consultation throughout the study but did not take part in data collection. As part of VFC as a novel method, face/content validation was conducted as a pre-test towards preliminary assessment of the effectiveness of VFC. In efforts to assess both user experience and the potential for VFC to become participatory in the future, the researchers conducted face/content validation while navigating each website platform (n = 4). Over a two-week period in June 2021, two researchers (AC, JM) collected food prices from the websites of four major retailers in Nova Scotia. The NNFB tool (NNFB Excel spreadsheet [20]) was used to calculate the cost of the NNFB for the 22 age, sex, and life stage groups. Using the weight (per kg) of each item, the researchers (AC, JM) recorded the least expensive option offered for each of the 61 NNFB grocery items [20]. For price validation (Table 1), the data collected using VFC was compared to 2015 PFC data [23], which was adjusted for 2021 inflation using a consumer price index (CPI) calculator [24] based in Canadian data.
Figure 1.
Figure 1. Flowchart of methods for virtual food costing.
iKT = integrated knowledge translation; PLWHA = a person living with HIV/AIDS; VFC = virtual food costing; NNFB = National Nutritious Food Basket; PFC = participatory food costing; CPI = consumer price index; NS = Nova Scotia.
Table 1.
Table 1. Comparing food costing results of the 2019 National Nutritious Food Basket (including +5% miscellaneous) collected from four major grocery stores located in Nova Scotia using virtual food costing (VFC) versus adjusted consumer price index 2015 participatory food costing (PFC) results.
Using the above outlined methodology, we calculated six different household scenarios for Nova Scotia (Table 2), with one individual living with HIV/AIDS in each household. Monthly household income was estimated based on employment status and eligibility for federal and provincial Income Assistance and benefits [2531]. To calculate estimated household expenses, four components of the MBM [32] were used for clothing, transportation, shelter, and miscellaneous expenses. The MBM expense estimates represented Nova Scotians across the province, including both rural and urban centre populations [32]. Food expenses were determined using the results of VFC. The 2019 NNFB for one week, plus 5% for miscellaneous costs, was calculated for the 22 age, sex, and life stage groups [20]. We then calculated the monthly cost of the NNFB by multiplying the weekly total by a factor of 4.33 [23]. For the household scenarios (Table 2), the monthly cost of the NNFB for each household member was added, and the total was multiplied by the appropriate household size adjustment factor [23]. Households with a PLWHA must also consider the cost of antiretroviral medications [33], dispensing fees [33, 34], a daily multivitamin [35], and an additional 10% of energy (food) intake [36, 37]. A 10% increase in food intake may be recommended, since a PLWHA can have up to a 10% increase in total energy expenditure [36, 37]. To best represent the cost of the 10% increase in energy intake for a PLWHA, 10% of the cost of the monthly NNFB was added for one person in the household. This method could be adapted for costing other special diets that require additional dietary expenses. In Nova Scotia, dispensing fees are paid for each 90-day supply of antiretrovirals, totalling $45 (CAD) annually [33]. Persons who are registered for Income Assistance can be reimbursed for dispensing fees but may be charged up to $5 (CAD) for each prescription filled [34]. The dispensing fees were represented in the household scenarios ($45 divided by 12 for monthly total) for those who would be responsible for paying dispensing fee costs. To determine the remaining income of each household, the cost of shelter, clothes, transportation, NNFB, daily multivitamin, medication dispensing fees (if applicable), and miscellaneous expenses were deducted from the total monthly income (Table 2).
Table 2.
Table 2. Affordability analysis—comparison of household scenarios including one person living with HIV/AIDS (PLWHA)
*Source: Basic Needs Assistance Standard Household Rate (BNASHR) ($1,393) [25] + Nova Scotia Child Benefit (NSCB) ($145.83) [27] + Canada Child Benefit (CCB) ($1,020.08) [28]. #Source: Minimum wage in Nova Scotia ($12.95 per hour; $2,072 monthly) [31] + NSCB ($145.83) [27] + CCB ($1,020.08) [28]. †Source: BNASHR ($1,013) [25] + NSCB ($145.83) [27] + CCB ($933.66) [28]. ‡Source: BNASHR-Enhanced ($950) [25]. §Source: BNASHR-Enhanced ($950) [25] + Nova Scotia Disability Support Program ($850) [29]. ¶Source: Old Age Security ($626.49) [30] + Guaranteed Income Supplement ($935.72) [26] + BNASHR-Enhanced ($950) [25]. Does not include income from Canada Pension Plan. ††Poverty Reduction Credit ($125 for 4 out of 12 months). Canada-Nova Scotia Targeted Housing Benefit not included [57]. GST/HST estimates (annual amount/12) [57]. ##Source: Dispensing fees in Nova Scotia for antiretroviral medications ($11.25 for 90-day supply; $45 annually) [33]. Individuals who receive Income Assistance can be reimbursed for dispensing fees but may pay up to $5 for each prescription. Antiretrovirals are free through the HIV Clinic in Halifax at the QEII hospital pharmacy. The Metro Dispensary Clinic, IWK Health Centre, Halifax, also provides low-cost prescription medications. A referral from a social worker at the HIV Clinic is needed to use this service [34]. ¶¶Source: Cost of daily multivitamin ($15.99 for 90-day supply; $64.76 annually). **Statistics Canada, Table 11-10-0066-01 [32]. Market Basket Measure (MBM) thresholds for the reference household by MBM region, component and base year divided by 12 for monthly expenses, household size adjusted using square root equivalence scale [58].

RESULTS

The results of the affordability analysis indicate that most Nova Scotia households including a PLWHA, either living on Income Assistance or with one minimum-wage earner, cannot reasonably afford a nutritious diet in addition to basic household expenses (Table 2). The calculations and results of the affordability analysis of six Nova Scotia household scenarios, which included one PLWHA in each, are presented in Table 2. The results indicate that households with an overall potential deficit after monthly expenses include a household of four on Income Assistance (−$1,058.70), a lone mother with two children on Income Assistance (−$973.65), a lone man on Income Assistance (−$677.40), and a household of four with one minimum-wage earner (−$383.45). After monthly expenses, a lone man with Disability Support Program income and a lone woman with Old Age Security and Guaranteed Income Supplement have a remaining $144.01 and $963.07, respectively.
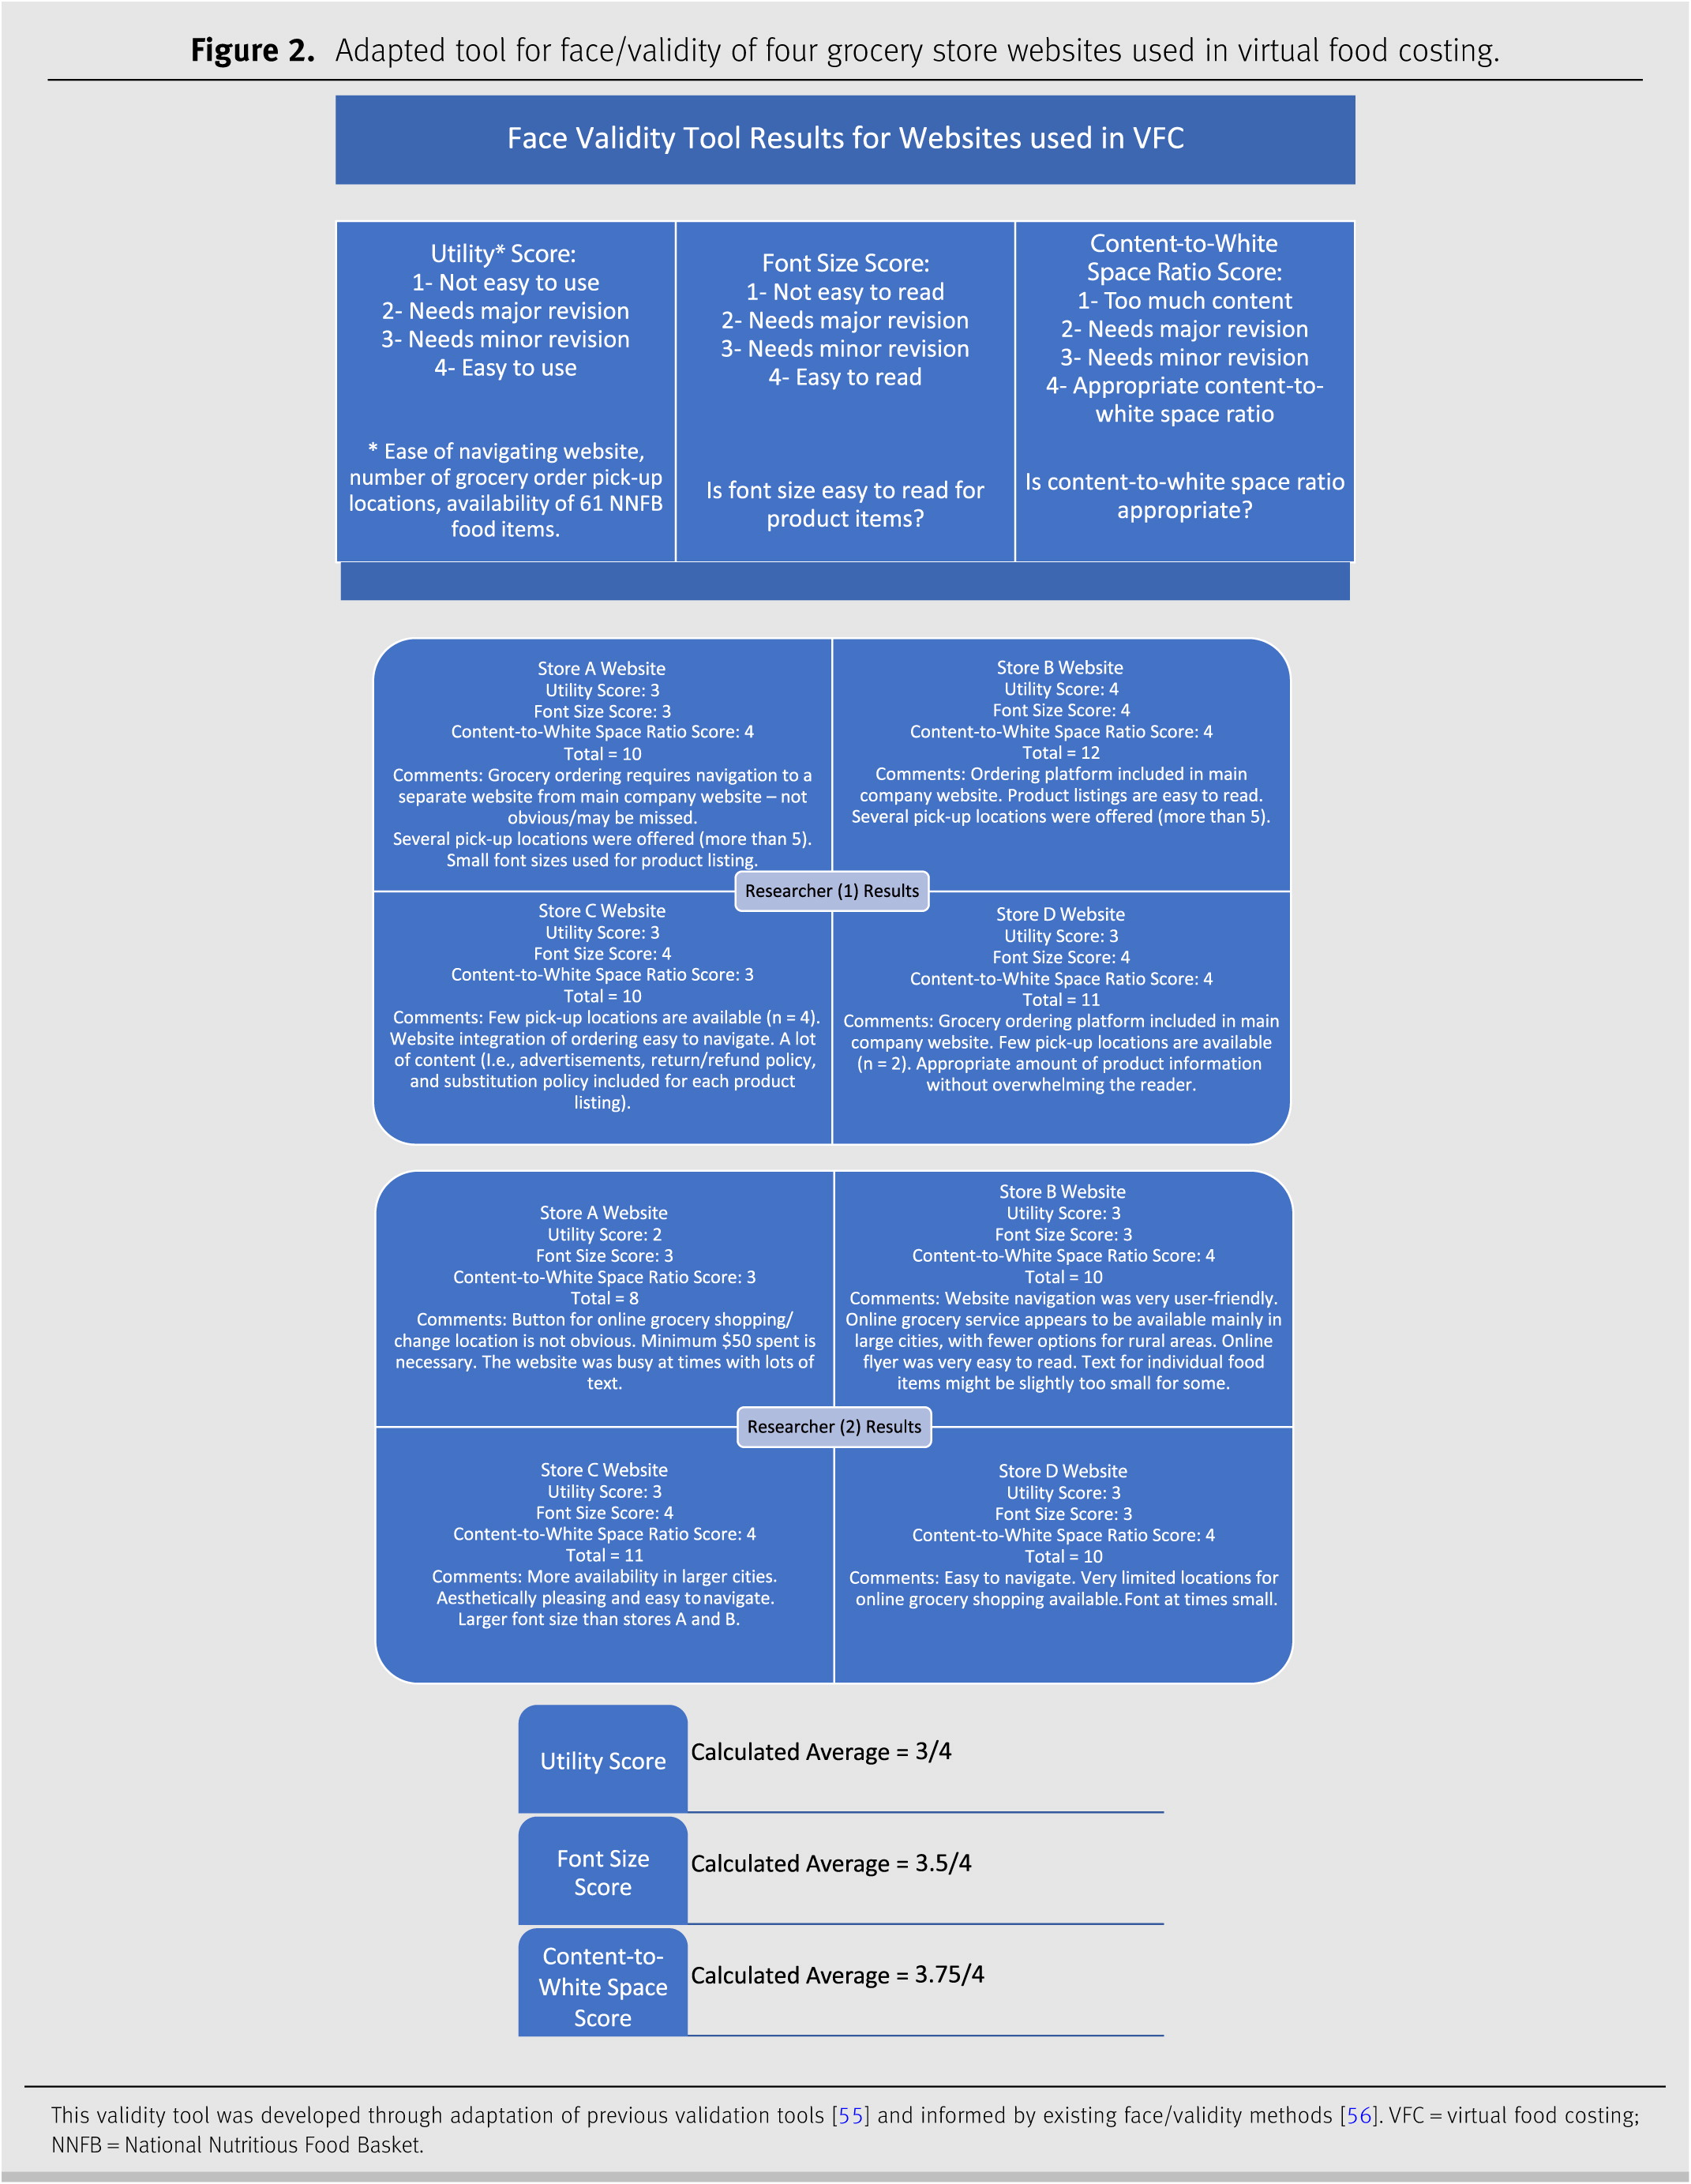
The results of the price validation comparison between VFC and PFC data indicate that the average difference in price between methods was $18.50 (CAD) higher per month for VFC than in-person PFC data (Table 1). Results of the face/content validation with the purpose of assessing user experience and the potential for VFC to become participatory can be found in Figure 2.
Figure 2.
Figure 2. Adapted tool for face/validity of four grocery store websites used in virtual food costing.
This validity tool was developed through adaptation of previous validation tools [55] and informed by existing face/validity methods [56]. VFC = virtual food costing; NNFB = National Nutritious Food Basket.

DISCUSSION AND CONCLUSIONS

This research set out to determine the cost of the NNFB and basic monthly expenses for households with a PLWHA in Nova Scotia. While the research team did collect the intended data that allowed us to conclude that the majority of Nova Scotia households with a PLWHA cannot reasonably afford the NNFB, we also had several lessons learned throughout the process of using VFC as a novel method for food costing that are outlined below.
The results of price validity indicated that there are discrepancies between virtual versus in-person food costing. The comparison between CPI adjusted 2015 PFC data and VFC data has notable differences in the price of the NNFB (Table 1). We postulate that one reason for this price discrepancy may be attributed to the unpredicted variations in CPI for specific food categories in Canada due to the COVID-19 pandemic [38]. However, as more people are shopping online not only for health and safety reasons but for ease and convenience as well [18], VFC prices may more accurately reflect what consumers are paying during this shift from in-person to online grocery shopping.
We found that VFC allowed for food costing to continue to monitor the price of food and risk of household food insecurity while pandemic-related restrictions were in place. This practice is valuable because it is the role of dietitians to advocate for the health and well-being of their communities, especially populations who have been marginalized [39]. People living with HIV/AIDS who are also living with poverty have limited access to suitable housing, nutritious food, and insured health services [40]. A chronic condition that hinders one’s ability to maintain stable employment, such as HIV/AIDS, is one of several factors that contribute to living with poverty and household food insecurity [41, 42]. Specifically for a PLWHA, household food insecurity is linked to adverse clinical outcomes, such as incomplete viral load suppression, reduced adherence to antiretrovirals, and heightened risk for mortality [42]. As a result of the health, social, and economic impacts of COVID-19, a PLWHA’s access to nutritionally adequate and safe foods has only worsened [43]. With this in mind, it is important to continue to monitor the price and affordability of food especially for populations living with HIV/AIDS.
Prior to the pandemic, researchers in Nova Scotia had found disparities in food availability for people across the province, particularly for people living in rural communities [44]. Specifically, there is a greater availability of nutritious food options in chain stores commonly located in urban areas [44]. This finding was echoed during VFC, as it was noted that most grocery stores only offered grocery order pick-up at select locations within the province, mainly in urban areas. It should also be noted, however, as VFC is a novel method and used in this study to address pandemic-related safety concerns associated with in-store food costing, geographical coverage of delivery and pick-up of online grocery orders was not a focus of this study. Traditional food access mapping, which accounts for locations of grocery stores and food deserts, does not consider the modern methods in which people are buying their groceries [45, 46]. Many consumers now prefer the use of apps and online shopping services and plan to continue using online services post-pandemic [18]. Consumer motivators to online shopping include speed, convenience, and personal safety [18]. Although these same motivators are consistent with food costing virtually rather than in-person, it is important to recognize the added value of engagement through in-store PFC for women with experience of food insecurity [4749]. Nonetheless, Canadians of all demographics have indicated they are more likely to continue grocery shopping using retailer-specific apps [18].
While stratified, random sampling is used in PFC to select a representative sample of Nova Scotia grocery stores [23], not all grocery stores maintain a website for online grocery ordering and delivery, rendering this more rigorous approach to sampling impractical for VFC. Thus, for this study, VFC was conducted with the four grocery stores that listed all 61 items of the NNFB on their websites, for consistency. In addition, orders filled by grocery store staff are subject to substitutions and eliminations based on store availability, which may impact the actual cost paid by the consumer. The subjective nature of these decisions cannot be accurately represented with VFC.
Though not an objective of our study, to our knowledge no other Canadian researchers have conducted VFC and compared results to in-person food costing. A study conducted in Oxford, United Kingdom, compared grocery store food prices, price promotions, front of package nutrition labels, and nutrition information to determine if the information available online served as a good proxy for in-person items [50]. In addition to our findings, this study also supports using virtual platforms as a novel method for food costing. Further research is needed to explore how VFC could adapt other approaches used as part of PFC, including training community members to collect online food price data themselves [23].

RELEVANCE TO PRACTICE

As one of the many roles of dietitians is to promote and protect the safety of their communities—especially populations who are vulnerable, VFC offers an opportunity for safer food costing/grocery shopping for those who are immunocompromised or those at increased risk for contracting illness. Food costing is important as it allows researchers and dietitians to inform government action and policy change to improve the health and wellness of individuals and families. Using VFC methods allows dietitians, nutritional experts, and researchers to continue to monitor the price of the NNFB in their province while pandemic-related restrictive measures are in place. Lockdown measures during COVID-19 significantly increased job losses and therefore food insecurity across the country [17, 5153]. Given these findings, it is imperative that food prices are regularly monitored to easily and rapidly monitor NNFB prices over time. This monitoring helps with advocating for changes in local, national, and international food and poverty policies, food prices, and economic access to nutritious food for all [54]. Virtual food costing methods may also have applications outside of the COVID-19 pandemic, as this novel methodology offers potential to reduce time and resources associated with participatory research involving vulnerable populations. We call on other dietitians, researchers, and policy developers to use VFC in their work to advocate for income and food equality.

Acknowledgements

The authors would like to thank Christine Johnson and Lindsay Cormier for their contributions to PFC endeavours on which the foundation of this manuscript is based. We would also like to thank FoodARC and Mount Saint Vincent University for their invaluable resources. This research will be used to inform subsequent work and the larger integrated knowledge translation initiative funded by ResearchNS and led by Phillip Joy and Shannan Grant, examining nutrition needs of people living with HIV/AIDS in Nova Scotia.
Financial support: This work was funded by ResearchNS: New Health Investigator Grant to the principal investigators, Dr. Phillip Joy and Dr. Shannan Grant.
Conflict of interest: The authors declare that they have no competing interests.

REFERENCES

1
Tarasuk V, Mitchell A. Household Food Insecurity in Canada 2017-2018 [Internet]. Toronto: Research to identify policy options to reduce food insecurity (PROOF); 2020 [cited 2021 Jul 13]. Available from: https://proof.utoronto.ca/wp-content/uploads/2020/03/Household-Food-Insecurity-in-Canada-2017-2018-Full-Reportpdf.pdf.
2
FAO. Rome declaration on world food security and world food summit plan of action [Internet]. World Food Summit, Rome; 1996 [cited 2021 Jul 13]. Available from: https://www.fao.org/3/w3613e/w3613e00.htm.
3
Statistics Canada. Canadian Income Survey, 2019 [Internet]. Government of Canada; 2021 [cited 2021 Jul 13]. Available from: https://www150.statcan.gc.ca/n1/daily-quotidien/210323/dq210323a-eng.htm.
4
Kirkpatrick SI, McIntyre L, Potestio ML. Child hunger and long-term adverse consequences for health. Arch Pediatr Adolesc Med [Internet]. 2010 [cited 2022 Apr 13];164. Available from: http://archpedi.jamanetwork.com/article.aspx?doi=10.1001/archpediatrics.2010.117.
5
Zajacova A, Jehn A, Stackhouse M, Choi KH, Denice P, Haan M, et al. Mental health and economic concerns from March to May during the COVID-19 pandemic in Canada: Insights from an analysis of repeated cross-sectional surveys. SSM - Popul Health. 2020;12:100704.
6
Men F, Fischer B, Urquia ML, and Tarasuk V. Food insecurity, chronic pain, and use of prescription opioids. SSM - Popul Health. 2021;14:100768.
7
Dowd JB, Zajacova A, and Aiello A. Early origins of health disparities: burden of infection, health, and socioeconomic status in U.S. children. Soc Sci Med. 2009;68:699–707.
8
Marshall C. Income support and HIV/AIDS: the Experience of persons living With HIV/AIDS in Nova Scotia. Nova Scotia: NS Advisory Commission on AIDS; 2006.
9
McKay FH, Lippi K, and Dunn M. Investigating responses to food insecurity among hiv positive people in resource rich settings: a systematic review. J Community Health. 2017;42:1062–1068.
10
Canada Employment and Social Development. Guaranteed income supplement – overview [Internet]. 2015 [cited 2021 Jul 26]. Available from: https://www.canada.ca/en/services/benefits/publicpensions/cpp/old-age-security/guaranteed-income-supplement.html.
11
Wolitski RJ, Stall R, Valdiserri RO, editors. Unequal opportunity: health disparities affecting gay and bisexual men in the United States. Unequal opportunity: health disparities affecting gay and bisexual men in the United States. New York: Oxford University Press; 2008. p. 251–274.
12
Food Action Resource Centre. What does it cost to eat healthy in your community? a training guide to participatory food costing. Mount Saint Vincent University; 2014.
13
Lemieux T, Milligan K, Schirle T, and Skuterud M. Initial impacts of the COVID-19 pandemic on the Canadian labour market. Can Public Policy. 2020;46:S55–S65.
14
Statistics Canada. Labour Force Survey, March 2020. 2020;43.
15
Statistics Canada. Food insecurity during the COVID-19 pandemic, May 2020. 2020;5.
16
Retail Council of Canada. Nova Scotia shuts down in-store non-essential retail; RCC secures additions to list of ‘essential’ retail products [Internet]. 2021 [cited 2021 Jul 26]. Available from: https://www.retailcouncil.org/province/ns/nova-scotia-shuts-down-in-store-non-essential-retail/.
17
Gallacher G and Hossain I. Remote work and employment dynamics under COVID-19: evidence from canada. Can Public Policy. 2020;46:S44–S54.
18
KPMG LLP Canada. Keeping up with the Canadian consumer. 2020;18.
19
Gagliardi AR, Berta W, Kothari A, Boyko J, and Urquhart R. Integrated knowledge translation (IKT) in health care: a scoping review. Implementation Sci. 2015;11:38.
20
Health Canada. 2019 National Nutritious Food Basket Reference Guide. Minister of Health; 2020.
21
Williams P, Amero M, Anderson B, Gillis D, Green-LaPierre R, Johnson C, et al. A participatory food costing model: in nova scotia. Can J Diet Pract Res. 2012;73:181–188.
22
Statistics Canada. Food insecurity during the COVID-19 pandemic, May 2020. 2020;5.
23
Voices for Food Security in Nova Scotia. Can Nova Scotians Afford to Eat Healthy?: Report on 2015 Participatory Food Costing [Internet]. Halifax, NS: Food Action Research Centre (FoodARC), Mount Saint Vincent University; 2017 [cited 2021 Jul 6]. Available from: https://www.deslibris.ca/ID/10094944.
24
Bank of Canada. Inflation Calculator [Internet]. [cited 2022 Apr 11]. Available from: https://www.bankofcanada.ca/rates/related/inflation-calculator/.
25
Government of Nova Scotia, Department of Community Services NS. Income Assistance (IA) | Standard Household Rate [Internet]. Basic Needs Assistance. [cited 2021 Jul 26]. Available from: https://novascotia.ca/coms/employment/basic-needs-assistance/index.html.
26
Canada Employment and Social Development. Guaranteed Income Supplement – Overview [Internet]. 2015 [cited 2021 Jul 26]. Available from: https://www.canada.ca/en/services/benefits/publicpensions/cpp/old-age-security/guaranteed-income-supplement.html.
27
Canada Revenue Agency. Province of Nova Scotia [Internet]. NSCB/NSALTC. 2010 [cited 2021 Jul 26]. Available from: https://www.canada.ca/en/revenue-agency/services/child-family-benefits/provincial-territorial-programs/province-nova-scotia.html.
28
Canada Revenue Agency. How much can you get - Canada child benefit (CCB) [Internet]. Calculate your Payments. 2020 [cited 2021 Jul 26]. Available from: https://www.canada.ca/en/revenue-agency/services/child-family-benefits/canada-child-benefit-overview/canada-child-benefit-we-calculate-your-ccb.html.
29
Government of Nova Scotia, Department of Community Services NS. Disability Support Program (DSP) Policy [Internet]. DSP Standard Household Rate. 2020 [cited 2021 Jul 26]. Available from: https://novascotia.ca/coms/disabilities/DSP-standard-household-rate.html.
30
Government of Canada. Old Age Security: Overview [Internet]. 2015 [cited 2021 Jul 26]. Available from: https://www.canada.ca/en/services/benefits/publicpensions/cpp/old-age-security.html.
31
Nova Scotia Labour and Advanced Education. Minimum Wage: NS Labour and Advanced Education, Employment Rights [Internet]. Minimum Wage. 2005 [cited 2021 Jul 26]. Available from: https://novascotia.ca/lae/employmentrights/minimumwage.asp.
32
Statistics Canada. Market Basket Measure (MBM) thresholds for the reference family by Market Basket Measure region, component and base year [Internet]. Report No.: Table 11-10-0066-01. [cited 2021 Jul 13]. Available from: https://www150.statcan.gc.ca/t1/tbl1/en/tv.action?pid=1110006601.
33
Yoong D, Bayoumi AM, Robinson L, Rachlis B, and Antoniou T. Public prescription drug plan coverage for antiretrovirals and the potential cost to people living with HIV in Canada: A descriptive study. CMAJ. 2018;6:E551–E560.
34
Nova Scotia Advisory Commission on AIDS. Information for persons living with HIV/AIDS about income assistance in Nova Scotia [Internet]. [cited 2021 Jul 13]. Available from: https://www.novascotia.ca/AIDs/documents/Income-Assistance-Information-for-Persons-Living-with-HIV-AIDS.pdf.
35
Rapid Response Service. Nutrition and HIV [Internet]. Toronto, ON: Ontario HIV Treatment Network; 2018 [cited 2021 Jul 27]. Available from: https://www.ohtn.on.ca/rapid-response-nutrition-and-hiv/.
36
Kosmiski L. Energy expenditure in HIV infection. AJCN. 2011;94:1677S–1682S.
37
Batterham MJ. Investigating heterogeneity in studies of resting energy expenditure in persons with HIV/AIDS: a meta-analysis. AJCN. 2005;81:702–713.
38
Statistics Canada. Consumer Price Index [Internet]. 2022 [cited 2022 Apr 11]. Available from: https://www150.statcan.gc.ca/t1/tbl1/en/tv.action?pid=1810000403.
39
Dietitians of Canada. Addressing household food insecurity in canada - position statement and recommendations - dietitians of Canada. Can J Diet Pract Res. 2016;77:159–159.
40
Realize Canada. E-Module for Evidence-Informed HIV Rehabilitation (E-Module) [Internet]. Canada: Realize; 2020 [cited 2021 Aug 8]. Available from: https://www.realizecanada.org/wp-content/uploads/emodule-2020-tagged.pdf.
41
Shimmin C. Backgrounder: the Impact of poverty on health [Internet]. 2015 [cited 2022 Apr 11]. Available from: http://evidencenetwork.ca/backgrounder-the-impact-of-poverty-on-health/.
42
Koehn K, McLinden T, Collins AB, McDougall P, Baltzer-Turje R, Miewald C, et al. Assessing the impact of food insecurity on HIV medication adherence in the context of an integrated care programme for people living with HIV in Vancouver, Canada. Public Health Nutr. 2020;23:683–690.
43
McLinden T, Stover S, and Hogg RS. HIV and food insecurity: a syndemic amid the COVID-19 pandemic. AIDS Behav. 2020;24:2766–2769.
44
Egbe M, Grant A, Waddington M, Terashima M, MacAulay R, Johnson C, et al. Availability and affordability of healthy and less healthy food in Nova Scotia: where you shop may affect the availability and price of healthy food. Public Health Nutr. 2021;24:2345–2353.
45
Terashima M, Hart C, and Williams P. Spatial analysis of population at risk of food insecurity using the voices from a Photovoice study: An exploratory mixed-methods approach. Can Food Studies, 2020;7:20–47.
46
George C, Tomer A. Beyond “food deserts”: America needs a new approach to mapping food insecurity [Internet]. Brookings Metro; 2021 [cited 2022 Apr 11]. Available from: https://www.brookings.edu/research/beyond-food-deserts-america-needs-a-new-approach-to-mapping-food-insecurity/.
47
Williams P. I would have never?: A critical examination of women’s agency for food security through participatory action research in Women redefining the experience of food insecurity: Life off the edge of the table. J. Page-Reeves (Ed.). London, UK: Lexington Books; 2014.
48
Monteith H, Anderson B, and Williams P. Capacity building and personal empowerment: participatory food costing in Nova Scotia, Canada Health Promot Int. 2019;35:321–330.
49
Johnson C, Williams P. The value of participatory food costing: views of the participants and support people, post spring 2002 food costing [Internet]. Nova Scotia, Canada: The Atlantic Health Promotion Research Centre, Nova Scotia Family Resource Centres/Projects (funded by the Canada Prenatal Nutrition Program & Community Action Program for Children), and Nova Scotia Nutrition Council; 2005. p. 1–23. [cited 2022 Apr 11]. Available from: https://foodarc.ca/wp-content/uploads/2013/05/Johnson-Williams_ValueofProcessParticipatoryFoodCosting1.pdf.
50
Bhatnagar P, Scarborough P, Kaur A, Dikmen D, Adhikari V, and Harrington R. Are food and drink available in online and physical supermarkets the same? A comparison of product availability, price, price promotions and nutritional information. Public Health Nutr. 2021;24:819–825.
51
Wakefield S. Eating in the age of COVID-19: food security in Canada during and after the pandemic. University College [Internet]. 2021 [cited 2021 Jul 6]; Available from: https://www.uc.utoronto.ca/eating-age-covid-19-food-security-canada-during-and-after-pandemic.
52
Men F and Tarasuk V. Food insecurity amid the COVID-19 pandemic: food charity, government assistance, and employment. Can Public Policy. 2021;47:202–230.
53
Deaton BJ and Deaton BJ. Food security and Canada’s agricultural system challenged by COVID-19: One year later. Can J Agric Econ. 2021;69:161–166.
54
Power E, Belyea S, and Collins P. “It’s not a food issue; it’s an income issue”: using Nutritious Food Basket costing for health equity advocacy. Can J Public Health. 2019;110:294–302.
55
Zamanzadeh V, Ghahramanian A, Rassouli M, Abbaszadeh A, Alavi-Majd H, and Nikanfar A. Design and Implementation Content Validity Study: Development of an instrument for measuring Patient-Centered Communication. J Caring Sci. 2015;4:165–178.
56
Peterson R. Constructing Effective Questionnaires. 1st ed. Thousand Oaks, California: Sage Publications Inc.; 2000.
57
Government of Canada. Goods and services tax/harmonised sales tax (GST/HST) credit: payments chart effective July 2021 - June 2022 (2020 base year) [Internet]. GST/HST Credit Overview. 2017 [cited 2022 Apr 11]. Available from: https://www.canada.ca/en/revenue-agency/services/child-family-benefits/goods-services-tax-harmonized-sales-tax-gst-hst-credit/goods-services-tax-harmonized-sales-tax-credit-calculation-sheet-july-2021-june-2022-payments-2020-tax-year.html.
58
Government of Nova Scotia. The Poverty Reduction Credit [Internet]. Community Services. 2013. Available from: https://novascotia.ca/coms/noteworthy/PovertyReductionCredit.html.

Information & Authors

Information

Published In

cover image Canadian Journal of Dietetic Practice and Research
Canadian Journal of Dietetic Practice and Research
Volume 84Number 2June 2023
Pages: 98 - 106
Editor: Naomi Cahill

History

Version of record online: 6 March 2023

Key Words

  1. food costing
  2. virtual food costing
  3. Nova Scotia
  4. food insecurity
  5. COVID-19
  6. nutritious food basket
  7. HIV

Mots-clés

  1. coût des aliments
  2. coût virtuel des aliments
  3. Nouvelle-Écosse
  4. insécurité alimentaire
  5. COVID-19
  6. panier de provisions nutritif
  7. VIH

Authors

Affiliations

Abigail Clarke
Department of Applied Human Nutrition, Mount Saint Vincent University, Halifax, NS, Canada
Jessica Mannette MA
Department of Applied Human Nutrition, Mount Saint Vincent University, Halifax, NS, Canada
Barb Hamilton-Hinch PhD
School of Health and Human Performance, Dalhousie University, Halifax, NS, Canada
Mary Lynch MD, FRCPC
Department of Anesthesia, Pain Management & Perioperative Medicine, Dalhousie University, Halifax, NS, Canada
QEII Health Sciences Centre, Halifax, NS, Canada
Founder (Pain Medicine), The Royal College of Physicians and Surgeons of Canada, Ottawa, ON, Canada
Patricia Williams PhD, PDt
Shannan Grant PhD, PDt
Department of Applied Human Nutrition, Mount Saint Vincent University, Halifax, NS, Canada
Departments Obstetrics and Gynaecology, IWK Health Centre, Halifax, NS, Canada
Departments Pediatrics, Obstetrics and Gynaecology, Dalhousie University, Halifax, NS, Canada
Phillip Joy PhD, PDt
Department of Applied Human Nutrition, Mount Saint Vincent University, Halifax, NS, Canada
Food Action Research Centre (FoodARC), Mount Saint Vincent University, Halifax, NS, Canada

Metrics & Citations

Metrics

Other Metrics

Citations

Cite As

Export Citations

If you have the appropriate software installed, you can download article citation data to the citation manager of your choice. Simply select your manager software from the list below and click Download.

There are no citations for this item

View Options

View options

PDF

View PDF

Get Access

Login options

Check if you access through your login credentials or your institution to get full access on this article.

Subscribe

Click on the button below to subscribe to Canadian Journal of Dietetic Practice and Research

Purchase options

Purchase this article to get full access to it.

Restore your content access

Enter your email address to restore your content access:

Note: This functionality works only for purchases done as a guest. If you already have an account, log in to access the content to which you are entitled.

Media

Media

Other

Tables

Share Options

Share

Share the article link

Share on social media