A Review of Statistical Reporting in Dietetics Research (2010–2019): How is a Canadian Journal Doing?
Publication: Canadian Journal of Dietetic Practice and Research
20 April 2021
Abstract
Despite the widespread use of statistical techniques in quantitative research, methodological flaws and inadequate statistical reporting persist. The objective of this study is to evaluate the quality of statistical reporting and procedures in all original, quantitative articles published in the Canadian Journal of Dietetic Practice and Research (CJDPR) from 2010 to 2019 using a checklist created by our research team. In total, 107 articles were independently evaluated by 2 raters. The hypothesis or objective(s) was clearly stated in 97.2% of the studies. Over half (51.4%) of the articles reported the study design and 57.9% adequately described the statistical techniques used. Only 21.2% of the studies that required a prestudy sample size calculation reported one. Of the 281 statistical tests conducted, 88.3% of them were correct. P values >0.05–0.10 were reported as “statistically significant” and/or a “trend” in 11.4% of studies. While this evaluation reveals both strengths and areas for improvement in the quality of statistical reporting in CJDPR, we encourage dietitians to pursue additional statistical training and/or seek the assistance of a statistician. Future research should consider validating this new checklist and using it to evaluate the statistical quality of studies published in other nutrition journals and disciplines.
Résumé
Malgré l’utilisation répandue de techniques statistiques dans la recherche quantitative, des failles méthodologiques et des rapports statistiques inadéquats persistent. L’objectif de cette étude est d’évaluer la qualité des procédures et des rapports statistiques dans tous les articles originaux et quantitatifs publiés dans la Revue canadienne de la pratique et de la recherche en diététique de 2010 à 2019 au moyen d’une liste de contrôle créée par notre équipe de recherche. Au total, 107 articles ont été évalués de manière indépendante par 2 évaluateurs. L’hypothèse ou les objectifs étaient clairement énoncés dans 97,2 % des études. Plus de la moitié (51,4 %) des articles mentionnaient la méthodologie de l’étude et 57,9 % décrivaient adéquatement les techniques statistiques employées. Seulement 21,2 % des études ayant nécessité un calcul de la taille de l’échantillon avant l’étude en indiquaient un. Sur les 281 tests statistiques réalisés, 88,3 % étaient corrects. Des valeurs P > 0,05–0,10 étaient décrites comme « statistiquement significatives » et/ou comme une « tendance » dans 11,4 % des études. Bien que cette évaluation révèle à la fois les forces et les points à améliorer dans la qualité des rapports statistiques de la Revue, nous encourageons les diététistes à suivre une formation supplémentaire en statistique et/ou à solliciter l’aide d’une ou un statisticien. Pour les recherches futures, il faudrait envisager de valider cette nouvelle liste de contrôle et de l’utiliser pour évaluer la qualité statistique des études publiées dans d’autres domaines et revues de nutrition.
INTRODUCTION
Despite the widespread use of statistical techniques in quantitative research, methodological flaws and inadequate statistical reporting persist [1–6]. A large proportion of peer-reviewed articles contain statistical and methodological errors that are large enough that they call into question the authors’ conclusions, and many of these errors stem from basic statistical techniques [7]. These problems are concerning because they suggest that many research articles are passing through the peer-review process without an adequate statistical review.
Although editors do not intentionally permit inappropriate statistical techniques and reporting, they and their reviewers often lack the expertise to provide a thorough statistical review [8]. Garza et al. [9] argued that many researchers believe that public trust in nutrition research is eroding, and high standards of rigor and reproducibility in research are important considerations to enhance and regain public confidence in nutrition science.
Since utilizing a statistician on research teams is not always feasible, editors of journals are tasked with finding reviewers for manuscripts who can provide a thorough statistical review. A proposed strategy to enhance the statistical standards of peer-reviewed research is to have a checklist on a journal’s website that authors can use prior to submission and to streamline the review process for the editor prior to the manuscript being sent for peer review.
The objective of the current study is to evaluate the quality of statistical reporting and procedures in all original articles published in the Canadian Journal of Dietetic Practice and Research (CJDPR) from 2010 to 2019 using a checklist created by our research team.
METHODS
All original research published from 2010 to 2019 in the CJDPR was assessed for adequacy of statistical reporting and correctness of applied statistical techniques. This statistical evaluation omitted all reviews, Perspectives in Practice articles, and reports. Of the 152 original research articles retrieved, 40 qualitative studies and 5 studies written in French were excluded. The remaining 107 articles (92 quantitative and 15 mixed methods) were included in this evaluation.
Checklist
Although other checklists exist to evaluate statistical quality [1, 10], many have design-focused rather than statistically focused questions [1, 11]. For this reason, the current checklist was adapted from one used by Parsons and colleagues for general orthopaedic journals [1], who in turn modified their questionnaire from Kilkenny et al.’s validated tool [12], and a new checklist was created.
Supplementary Table 11 provides the checklist and the criteria used to assess the statistical quality of procedures and reporting in CJDPR. The checklist contains 12 questions, 7 of which include subsections, for a total of 34 items. Six of the 12 questions were adapted from the Parsons et al. questionnaire [1]. The remaining questions were decided upon by the research team, including a biostatistician (JAS), with additional input from an assessment of statistical reporting practices for question 12 [13]. The checklist was designed in accordance with how a rater would be evaluating an article—introduction, methods, and then results. Checklist questions were answered with a “Yes,” “No,” or “N/A” (not applicable) response (28 items), or a written response (6 items).
Pilot testing
The checklist was independently pretested by 2 authors (HS and HL) trained in graduate-level statistics. The pilot was conducted on 10 articles from various nutrition journals, excluding CJDPR. The articles were purposefully chosen to ensure the checklist could be applied to a broad range of study designs. Once the pilot test was complete, some questions were amended or removed if they were deemed unclear or too subjective.
Data abstraction and analysis
After the checklist was finalized, the same 2 raters independently reviewed all 107 papers. The raters then compared their checklist responses and resolved any discrepancies by discussion. The research team’s biostatistician (JAS) adjudicated any checklist items when consensus could not be reached. Final responses for each article were recorded in Excel (Microsoft Corp., Redmond, Washington). For data analysis, frequencies were tallied, and percentages computed for each “Yes,” “No,” and “N/A,” or written response for all items. SPSS version 26 (IBM SPSS Statistics for Windows, version 26.0. Armonk, New York: IBM Corp.) was used to calculate measures of central tendency for numeric responses to question 3d.
RESULTS
The 34-item checklist was applied to all 107 articles, resulting in 3638 items completed by each rater independently. The level of agreement between raters was 83.5% (3037/3638). At least 1 disagreement was encountered in 103/107 of the papers assessed (96.3%). Reasons for disagreement were frequently related to articles inadequately reporting the statistical techniques used. Of the 601 disagreements encountered, 444 (73.9%) were solved amongst the 2 raters and 157 (26.1%) were adjudicated.
Reporting of objectives and study design
Results from the checklist can be found in Table 1. The hypothesis or objective(s) was clearly stated in 97.2% (104/107) of the studies. However, the study design was only reported in 51.4% (55/107) of the articles, with cross-sectional studies being the most reported design (72.7%).
Table 1.
Note: Percentages were computed with the total number of articles (107) as the denominator, unless otherwise stated (e.g., n = 55).
a
A not applicable (N/A) response was applied, as the total sample size (N) was not reported.
b
The number of “Yes,” “No,” and “N/A” responses sum to >107, as multiple types of a statistical test (e.g., 1 independent and 1 paired t test) were performed in some papers.
c
A “Yes, NA” response was given when authors conducted a multiple comparisons adjustment (e.g., a post-hoc test following a one-way ANOVA), but their number of hypotheses formally tested (response to question 11a) was 0 or 1.
d
“No, Bonferroni” or “No, Tukey” was given when authors applied a Bonferroni correction or Tukey’s test at some point (e.g., to pairwise comparisons), but no adjustment was made for the ≥2 hypotheses formally tested (response to question 11a).
Sample size
Only 47.9% (23/48) of the studies justified their sample size. The sample size was considered justified when a sample size calculation was reported, census data were used, or when the primary outcome was tested using multivariable regression and the sample size was ≥10× the number of predictor variables included in the model [14]. A “N/A” response to question 3a was given for 59 articles (55.1%) that did not need justification for their sample size, as they did not involve formal hypothesis testing or did not use inferential statistics. Likewise, 74 studies (69.2%) received a “N/A” response for question 3b, as they did not involve formal hypothesis testing, did not use inferential statistics, used census data, or had an appropriate sample size for the multivariable regression used to test their primary outcome. Of the articles that required a sample size calculation, 26 (78.8%) did not include one. Of the 7 studies that did conduct a sample calculation, only 3 (42.9%) were adequately reported.
The absolute difference in size and percent of the total sample (N) between groups was calculated for studies in which the primary objective used inferential statistics to compare groups. Large differences between groups were observed, as the median absolute difference in size was 17 (range: 0–494) and the mean percentage of N between groups was 41% (standard deviation, SD = 24%).
Probability sampling is preferred over nonprobability methods, as the former increases the likelihood that a sample is representative of the target population [15]. Only 15 studies (14%) used probability sampling, 5 (4.7%) used a combination of probability and nonprobability methods, and the remaining 75 studies (70.1%) used nonprobability sampling. Although probability sampling is neither possible nor necessary in some research studies, nonprobability sampling lacks generalizability [15].
Missing data
Data were missing in 76 studies (71%). Data were missing when frequencies given in the results/tables summed to less than the N reported and/or when the authors included a statement explaining missing data in the text or table descriptions. Of the 76 articles with missing data, 19 (25%) provided no explanation why data were missing. Articles that did not explain missing data were given an “unknown” response for question 5c. Of the 57 articles that explained missing data, missing values were most often omitted (28 articles (49.1%)) or included in the analysis (20 articles (35.1%)). One paper (1.8%) analyzed data with and without missing values.
Measures of central tendency and dispersion
Of the studies that reported measures of central tendency, the appropriate measure was used in 63 (80.8%) of them. A “Yes” response to question 6a was given when the mean was used for normally distributed interval/ratio variables and/or when the median was used for ordinal or skewed interval/ratio variables. The mode is the appropriate measure of central tendency for nominal data.
A measure of dispersion accompanied a measure of central tendency in 72 papers (92.3%), 12 (16.9%) of which did not use the correct measure of dispersion. Common errors that warranted a “No” response for question 6c were use of the standard error (SE) or the range with the mean, when the SD should have been used. The SE should not be used to describe the variability of individual observations about the mean [16].
Statistical reporting
Overall, 45 (42.1%) studies did not adequately report their statistical tests. Inappropriate reporting occurred when authors did not specify the type of statistical test used, if results of a statistical test not proposed in the methods were reported in the results, if results of a statistical test proposed in the methods were not subsequently reported, if there was a discrepancy between statistical procedures stated in the abstract versus the manuscript, or if the raters could not determine which statistical procedures were used due to inadequate reporting.
Statistical methods
For question 8, a “Yes” or “No” response was given depending on the level of measurement of the variables and if the assumptions of the statistical test(s) were met; 2 × 2 χ2 tests were marked incorrect when >20% of cells had expected frequencies <5 [17], and regression models were incorrect when the sample size was <10× the number of predictor variables [14]. An independent samples t test was incorrect when authors compared dependent means, when the dependent variable was not measured on a continuous scale, and/or when the independent variable contained more than 2 levels. A paired t test was incorrect when it compared the independent means of 2 groups, instead of observations that are dependent (e.g., before and after scores). The Mann–Whitney U-test was used inappropriately when studies compared the means of 2 (or more) independent groups on a continuous scale and where the data followed a normal distribution, or when the observations were dependent of each other. The analysis of variance (ANOVA) was misused when the dependent variable was categorical, or when the 1-way ANOVA was used to analyze repeated-measures data. The Pearson’s correlation coefficient was used incorrectly when it measured the association between categorical variables. The Spearman’s rank correlation coefficient or Kendall’s tau correlation can be used for ordinal variables, but not continuous variables [15].
Fifteen studies (14.0%) were given a “Yes” response for question 8a (“None”), as no statistical tests were performed. The most frequent statistical tests were χ2 (43 tests, 15.3%), t tests (40 tests, 14.2%) and regression models (39 tests, 13.9%). Of the 281 statistical tests performed in the 107 papers, 33 tests (11.7%) were incorrect. Specifically, 5 χ2 tests (11.6%), 5 t tests (12.5%), 3 Mann–Whitney U tests (23.1%), 10 ANOVA tests (30.3%), 5 correlations (13.9%), and 3 regression models (7.7%) were applied incorrectly. Two “Other” statistical tests (question 8l, 4.4%) were marked incorrect, both of which were Cohen’s kappa tests. Cohen’s kappa was incorrect when the cross tabulation was not symmetric (e.g., 2 × 3), the 2 raters were not independent, and/or the variables were continuous [18]. Supplementary Table 21 presents a detailed view of the statistical tests recorded for questions 8b–8g.
Only 1 article (1.5%) received a “No” response for question 9a. A greater number of articles (10, 15.4%) did not use nonparametric methods for data with a skewed distribution. For instance, when authors incorrectly used one-way ANOVA to compare the means of an ordinal or skewed continuous variable, they were given a “No” response for question 9b, as the Kruskal–Wallis test should have been used. Since categorical data are not from a normal distribution, any nominal or ordinal variables that were treated as such were marked incorrect. Visual inspection and reported tests for normality (e.g., Kolmogorov–Smirnov, Shapiro–Wilk) were used to assess normality of continuous variables.
Sample size reporting on tables and figures
The sample size was not stated in all figures and tables in 47 articles (43.9%). A “No” response to question 10 was given when authors did not report their sample size in all figures and tables depicting participant demographics or statistical analyses.
Multiple hypothesis testing
Only statistical tests pertaining to the primary objective or hypothesis were included when counting the number of hypotheses formally tested (question 11a). Unfortunately, many studies did not state which of their objectives was the primary. The raters assumed that the first objective listed was the primary objective and thus counted the P values specific to that objective. Many articles tested >1 hypothesis (42 (39.3%)). Four articles (3.7%) tested >50 hypotheses, with 1 article testing 84. Of the articles testing >1 hypothesis, 5 (11.9%) accounted for this by conducting a multiple comparisons adjustment. The most common adjustment performed was the Tukey’s test (2 (33.3%)). It is noteworthy that 12 studies (11.2%) received a “Yes, N/A” response for question 11b, meaning that they did not test a formal hypothesis or only tested 1 hypothesis, but conducted a multiple comparisons adjustment for another reason (e.g., a post-hoc test following a one-way ANOVA to investigate differences between groups).
P value reporting
Question 12 assessed authors’ reporting of P values >0.05–0.10 as “statistically significant” and/or a “trend.” This occurred in 10 (11.4%) studies. One study described a P value of >0.05–0.10 as “statistically significant” and 9 described a P value of >0.05–0.10 as a “trend.” A “N/A” response was given when no P values were reported. Reporting nonsignificant P values as a “trend” (let alone statistically significant) is misleading because, even with a substantial proportion of extra data, this would not assure that the P value would become smaller [19]. Moreover, if researchers disregarded the P value and simply reported the effect size and 95% confidence interval (CI), the CI would either be statistically significant or not.
Changes over time
Results for questions 7 and 8 were graphed by year and visually assessed for changes over time (see Figure 1). There was no tendency towards improvement or worsening of the quality of statistical reporting (Figure 1a) or statistical test procedures (Figure 1b). Reporting errors were highest in 2018 (62.5%) and lowest in 2016 and 2019 (both 27.3%). Total statistical test errors were highest in 2019 (19.4%) and lowest in 2013—the only year in which no errors of this type were made (0.0%). As seen in Figure 1c, the percentage of articles with at least 1 statistical test error was greatest in 2014 (33.3%).
Figure 1.
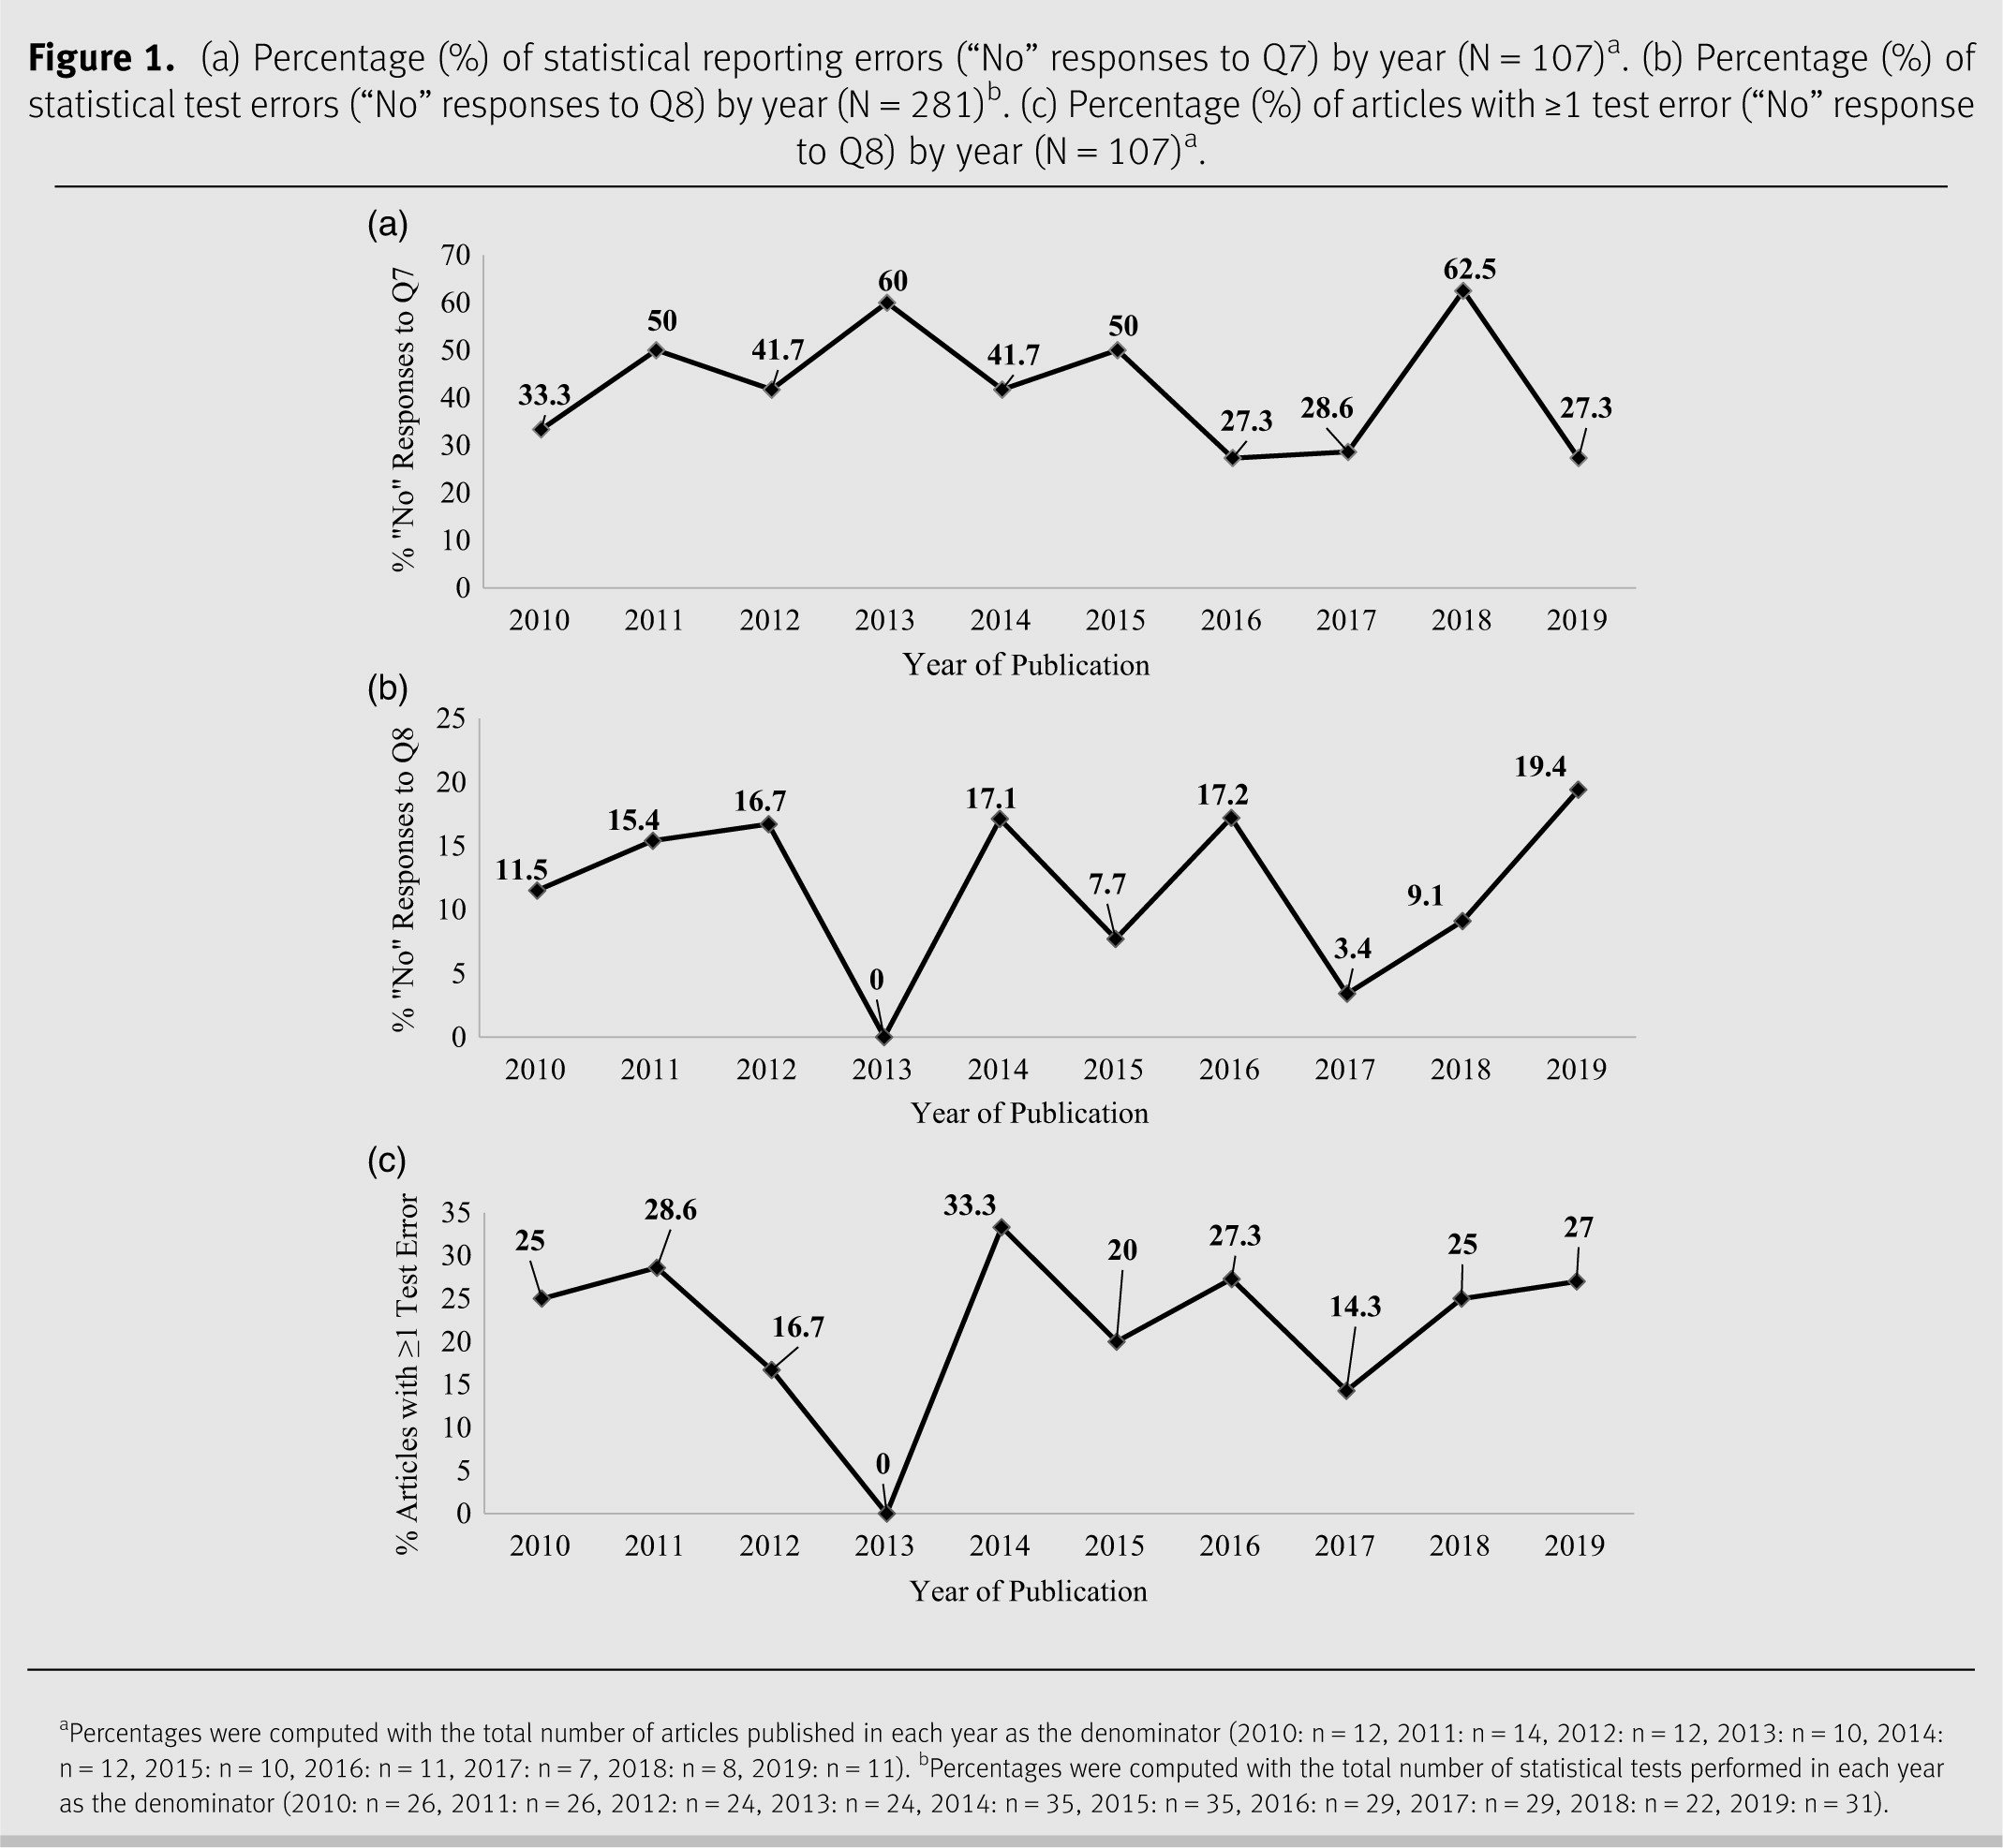
Figure 1. (a) Percentage (%) of statistical reporting errors (“No” responses to Q7) by year (N = 107)a. (b) Percentage (%) of statistical test errors (“No” responses to Q8) by year (N = 281)b. (c) Percentage (%) of articles with ≥1 test error (“No” response to Q8) by year (N = 107)a.
aPercentages were computed with the total number of articles published in each year as the denominator (2010: n = 12, 2011: n = 14, 2012: n = 12, 2013: n = 10, 2014: n = 12, 2015: n = 10, 2016: n = 11, 2017: n = 7, 2018: n = 8, 2019: n = 11). bPercentages were computed with the total number of statistical tests performed in each year as the denominator (2010: n = 26, 2011: n = 26, 2012: n = 24, 2013: n = 24, 2014: n = 35, 2015: n = 35, 2016: n = 29, 2017: n = 29, 2018: n = 22, 2019: n = 31).
DISCUSSION
This study assessed the quality of statistical reporting and procedures in original, quantitative articles published from 2010 to 2019 in CJDPR. Our evaluation revealed both strengths and areas for improvement. When comparing the results of the present study to those of previous statistical reviews, it should be noted that, although differing instruments were used, similar statistical concepts were evaluated and are comparable.
Statistical reporting
It is important that researchers report their study design. The research design determines, in part, how the data should be analyzed and communicated [20, 21]. It is concerning that 48.6% of the articles did not report the study design.
The majority (72.7%) of the articles stated the study design used cross-sectional methods. This finding closely parallels Aljoudi’s evaluation, where 76.4% of the articles were cross-sectional [22]. While this is not necessarily problematic, researchers are unable to infer causal relationships between diet and disease onset from cross-sectional studies [20, 21].
Missing data can threaten the generalizability of a study’s findings and decrease statistical power [23, 24]. Furthermore, differential attrition, which may result in missing values, can create bias and threaten internal validity [23, 25]. The STROBE-Nut guidelines for nutritional epidemiology research suggest that authors “report the number of individuals excluded based on missing, incomplete, or implausible dietary data” [26]. Promisingly, missing data were explained in most (75%) studies reviewed with missing values. This prevalence is like a previous evaluation, which found that 83% of the included cohort studies discussed how missing data were handled [27].
Inadequate reporting of statistical procedures may lead to a misunderstanding and misinterpretation of a study’s methods and findings [7]. The Statistical Analyses and Methods in the Published Literature (SAMPL) guidelines were created to attenuate poor reporting, yet statistical reporting errors persist [7]. The present evaluation found that 42.1% of the articles did not adequately report all their statistical techniques. This number is higher than previous evaluations, including one conducted on dental research, which found that 32.5% of the publications incompletely described their statistical methods [28].
An additional reporting issue was that the sample size was not stated in all tables and figures in 43.9% of the articles. Previous studies have evaluated other elements of reporting on graphs, such as the clarity of titles and legends and the inclusion of raw data for individual patients [1, 28]. We focused on the authors’ provision of the “N” or “n” in visual depictions of their data/statistical analyses, as this minimizes obscurity of missing data and allows readers to critically appraise the sufficiency of the sample size for the statistical tests employed.
Statistical methods
Like results of previous statistical reviews [1, 29, 30], only 21.2% of CJDPR studies that required a sample size calculation included one. When an a priori sample size calculation is not estimated, researchers risk their study being underpowered, increasing the likelihood of a type II error (i.e., “false negative”). It is essential that, prior to the initiation of a research project, researchers determine the primary outcome of interest, the level of measurement of the outcome, what a practically or clinically meaningful effect size would be, and the expected variability of the outcome [15, 31]. Without knowledge of these statistical considerations, it is highly advisable that researchers seek the assistance of a statistician [15].
In the present study, 11.7% of the statistical tests were incorrect. This is concerning, as inappropriate use of statistical tests can lead to a distortion of the findings, possibly even discrediting the conclusions drawn [7, 32]. Similar errors have been noted in other evaluations. In their review of the quality of quantitative counselling research, Wester et al. [33] found results almost identical to ours, where 11.4% of the statistical analyses conducted were incorrect [33]. Kim et al. [34] examined the extent of misused statistics or statistical errors in dental research, and found that 51.5% of the articles had at least 1 statistical error, and many of the errors were similar to our own, such as the use of parametric tests for ordinal data.
Multiple hypothesis testing is common in research and poses a serious issue, as it can substantially increase the risk of a type I error or “false positive” (i.e., the incorrect rejection of a true null hypothesis) [35, 36]. To account for this, multiple comparison adjustment techniques (e.g., the Bonferroni correction) have been suggested when a study is testing multiple hypotheses [36]. These techniques were uncommon in the present evaluation, where only 11.9% of the articles that tested >1 hypothesis adjusted for multiple comparisons. This issue has been found in other fields of research. A review of otolaryngology journals [37] found that only 10% of the articles that tested ≥5 hypotheses used a multiple comparisons adjustment. Moreover, when the Bonferroni correction was applied to the remaining articles, only 57% of the P values remained statistically significant [37].
Study strengths and limitations
The biggest strength of this evaluation was that articles from CJDPR were assessed over 10 years. However, a limitation was that our checklist was piloted, but not validated. Nevertheless, 83.5% agreement was achieved between the 2 raters, thus a similar level of agreement is anticipated for future research using this tool. Also, even though our checklist was created to be as objective as possible, the raters were required to use some subjectivity when reporting was poor. For example, when authors did not specify which of their objectives was the primary, the raters assumed that the first objective mentioned was the primary objective. To minimize subjectivity, the raters used the same decision-making process for every paper to ensure consistency. In addition, although the raters read the discussion and limitations within each article, if authors identified statistical concerns (e.g., a small sample size) in those sections, the raters did not change their responses to the checklist questions (e.g., “Is the sample size justified in the methods?”). This was done to maintain the objectivity of our checklist. Furthermore, while questions 2 and 4 in the checklist are considered measures of general methodological quality, these questions were included because study design and sampling methods can impact the appropriateness of the statistical methods used. Future research should consider validating this newly designed checklist and using it independently or in combination with existing guidelines (e.g., STROBE, SAMPL) to evaluate the statistical quality of studies published in different nutrition journals, and other research disciplines as well.
RELEVANCE TO PRACTICE
Based on the results of this statistical review, we encourage nutrition researchers to reflect on their level of statistics knowledge and pursue additional training and/or seek the assistance of a statistician as needed. Next, we suggest that CJDPR and all other scholarly journals, in addition to the peer-review process, conduct a thorough statistical review of submitted manuscripts prior to publication. To do this, our checklist and the corresponding criteria may be used in the statistical review process. Our checklist may also be a valuable tool when teaching research methodology and statistics courses within health education programs. Further, we recommend more robust statistics training in accredited dietetic and other health education programs. The ability to critically appraise and conduct high-quality research is essential to advance evidence-based practice in nutrition science.
Financial support: This project was funded by a Brescia University College Internal Research Grant.
Conflict of interest: The authors declare that they have no competing interests.
Footnote
1
Supplementary data are available with the article through the journal Web site at Supplementary Material.
References
1
Parsons NR, Price CL, Hiskens R, Achten J, and Costa ML. An evaluation of the quality of statistical design and analysis of published medical research: results from a systematic survey of general orthopaedic journals. BMC Med Res Methodol. 2012 Apr;12(1):60.
2
Karadenz PG, Uzabac E, Kuyuk SA, Kesn FK, Can FES, and Ercan I. Statistical errors in articles published in radiology journals. Diagn Interv Radiol. 2019 Mar;25(2):102–8.
3
Kouvelioti R and Vagenas G. Methodological and statistical quality in research evaluating nutritional attitudes in sports. Int J Sport Nutr Exerc Metab. 2015 Dec;25(6):624–35.
4
Fernandes-Taylor S, Hyun J, Reeder R, and Harris A. Common statistical and research design problems in manuscripts submitted to high-impact medical journals. BMC Res Notes. 2011 Aug;4:304.
5
Bahar B, Pambuccian SE, Barkan GA, and Akdaş Y. The use and misuse of statistical methods in cytopathology studies: review of 6 journals. Lab Med. 2019 Feb;50(1):8–15.
6
Wu S, Jin Z, Wei X, Gao Q, Lu J, Ma X, et al. Misuse of statistical methods in 10 leading Chinese medical journals in 1998 and 2008. Sci World J. 2011 Nov;11:2106–14.
7
Lang TA and Altman DG. Basic statistical reporting for articles published in Biomedical Journals: the “Statistical Analyses and Methods in the Published Literature” or the SAMPL Guidelines. Int J Nurs Stud. 2015 Jan;52(1):5–9.
8
Petrovečki M. The role of statistical reviewer in biomedical scientific journal. Biochem Med. 2009 Oct;19(3):223–30.
9
Garza C, Stover PJ, Ohlhorst SD, Field MS, Steinbrook R, Rowe S, et al. Best practices in nutrition science to earn and keep the public’s trust. Am J Clin Nutr. 2019 Jan;109(1):225–43.
10
Yim KH, Nahm FS, Han KA, and Park SY. Analysis of statistical methods and errors in the articles published in the Korean journal of pain. Korean J Pain. 2010 Mar;23(1):35–41.
11
The EQUATOR Network (Enhancing the QUAlity and Transparency Of health Research) [Internet]. Oxford, UK: University of Oxford; n.d. [cited 2020 Jun 8]. Available from: http://www.equator-network.org/.
12
Kilkenny C, Parsons N, Kadyszewski E, Festing MFW, Cuthill IC, Fry D, et al. Survey of the quality of experimental design, statistical analysis and reporting of research using animals. PLoS ONE. 2009 Nov;4(11):e7824.
13
Diong J, Butler AA, Gandevia SC, and Heroux ME. Poor statistical reporting, inadequate data presentation and spin persist despite editorial advice. PLoS ONE. 2018 Aug;13(8):e0202121.
14
Peduzzi P, Concato J, Feinstein AR, and Holford TR. Importance of events per independent variable in proportional hazards regression analysis II. Accuracy and precision of regression estimates. J Clin Epidemiol. 1995 Dec;48(12):1503–10.
15
Boushey CJ, Harris J, Bruemmer B, and Archer SL. Publishing nutrition research: a review of sampling, sample size, statistical analysis, and other key elements of manuscript preparation, Part 2. J Am Diet Assoc. 2008 Apr;108(4):679–88.
16
Macaskill P. Standard deviation and standard error: interpretation, usage and reporting. Med J Aust. 2018 Feb;208(2):63–4.
17
Kim HY. Statistical notes for clinical researchers: chi-squared test and Fisher’s exact test. Restor Dent Endod. 2017 May;42(2):152–5.
18
Altman DG. Practical statistics for medical research. Boca Raton, FL: Chapman & Hall/CRC Press; 1999. 611 p.
19
Wood J, Freemantle N, King M, and Nazareth I. Trap of trends to statistical significance: likelihood of near significant P value becoming more significant with extra data. BMJ. 2014 Mar 31;348:g2215.
20
Boushey C, Harris J, Bruemmer B, Archer SL, and Van Horn L. Publishing nutrition research: a review of study design, statistical analyses, and other key elements of manuscript preparation, Part 1. J Am Diet Assoc. 2006 Jan;106(1):89–96.
21
Jacob RF and Carr AB. Hierarchy of research design used to categorize the “strength of evidence” in answering clinical dental questions. J Prosthet Dent. 2000 Feb;83(2):137–52.
22
Aljoudi A. Study designs and statistical methods in the Journal of Family and Community Medicine: 1994-2010. J Family Community Med. 2013 Jan–Apr;20(1):8–11.
23
Mason MJ. A review of procedural and statistical methods for handling attrition and missing data in clinical research. Meas Eval Couns Dev. 1999 Jul;32(2):111–8.
24
Kang H. The prevention and handling of the missing data. Korean J Anesthesiol. 2013 May;64(5):402–6.
25
Rubin DB. Multiple imputation for nonresponse in surveys. New York, NY: Wiley; 1987. 258 p.
26
Lachat C, Hawwash D, Ocke MC, Berg C, Forsum E, Hornell A, et al. Strengthening the reporting of observational studies in epidemiology-nutritional epidemiology (STROBE-nut): an extension of the STROBE statement. PLoS Med. 2016 Jun;13(6):e1002036.
27
Karahalios A, Baglietto L, Carlin JB, English DR, and Simpson JA. A review of the reporting and handling of missing data in cohort studies with repeated assessment of exposure measures. BMC Med Res Methodol. 2012 Jul;12:96.
28
Vähänikkilä H, Tjäderhane L, and Nieminen P. The statistical reporting quality of articles published in 2010 in five dental journals. Acta Odontol Scand. 2015 Jan;73(1):76–80.
29
Langan S, Schmitt J, Coenraads P-J, Svensson Å, Von Elm E, and Williams H. The reporting of observational research studies in dermatology journals: a literature-based study. Arch Dermatol. 2010 May;146(5):534–41.
30
Allam RM, Noaman MK, Moneer MM, and Elattar IA. Assessment of statistical methodologies and pitfalls of dissertations carried out at National Cancer Institute, Cairo University. Asian Pac J Cancer Prev. 2017 Jan;18(1):231–7.
31
Noordzij M, Tripepi G, Dekker FW, Zoccali C, Tanck MW, and Jager KJ. Sample size calculations: basic principles and common pitfalls. Nephrol Dial Transplant. 2010 May;25:1388–93.
32
Burke DA, Whittemore SR, and Magnuson DSK. Consequences of common data analysis inaccuracies in CNS trauma injury basic research. J Neurotrauma. 2013 May;30(10):797–805.
33
Wester KL, Borders LD, Boul S, and Horton E. Research quality: critique of quantitative articles in the Journal of Counseling & Development. J Couns Dev. 2013 Jul;91(3):280–90.
34
Kim JS, Kim DK, and Hong SJ. Assessment of errors and misused statistics in dental research. Int Dent J. 2011 Jun;61(3):163–7.
35
Benjamini Y and Hochberg Y. Controlling the false discovery rate: a practical and powerful approach to multiple testing. J R Stat Soc Series B Stat Methodol. 1995 Jan;57(1):289–300.
36
Chen SY, Feng Z, and Yi X. A general introduction to adjustment for multiple comparisons. J Thorac Dis. 2017 Jun;9(6):1725–9.
37
Kirkham EM and Weaver EM. A review of multiple hypothesis testing in otolaryngology literature. Laryngoscope. 2015 Mar;125(3):599–603.
Supplementary Material
File (cjdpr-2021-005suppla.docx)
- Download
- 33.68 KB
Information & Authors
Information
Published In

Canadian Journal of Dietetic Practice and Research
Volume 82 • Number 2 • June 2021
Pages: 59 - 67
Editor: Naomi Cahill
History
Version of record online: 20 April 2021
Copyright
© 2021.
Authors
Metrics & Citations
Metrics
Other Metrics
Citations
Cite As
HollySchaafsmaMScFN (c), HollyLaasanenPHEc, MScFN (c), JasnaTwynstraPhD, and Jamie A.SeabrookPhD. 2021. A Review of Statistical Reporting in Dietetics Research (2010–2019): How is a Canadian Journal Doing?. Canadian Journal of Dietetic Practice and Research.
82(2): 59-67. https://doi.org/10.3148/cjdpr-2021-005
Export Citations
If you have the appropriate software installed, you can download article citation data to the citation manager of your choice. Simply select your manager software from the list below and click Download.
Cited by
1. How Many Participants Are Needed? Strategies for Calculating Sample Size in Nutrition Research
2. Does Dietitian Involvement During Pregnancy Improve Birth Outcomes? A Systematic Review
3. Examining Elementary School Children’s Knowledge about Food and Nutrition in Southwestern Ontario, Canada
View Options
View options
Login options
Check if you access through your login credentials or your institution to get full access on this article.
Subscribe
Click on the button below to subscribe to Canadian Journal of Dietetic Practice and Research