Open access

Students’ Food Intake from Home-Packed Lunches in the Traditional versus Balanced School Day

Publication: Canadian Journal of Dietetic Practice and Research
25 October 2016

Abstract

Purpose: To assess the type and quantity of foods children brought and consumed at school in the balanced school day (BSD), with two 20-minute eating periods, versus the traditional schedule (TS), with one 20-minute lunch.
Methods: Direct observation identified food items and amounts in BSD and TS lunches of grade 3 and 4 students (n = 321).
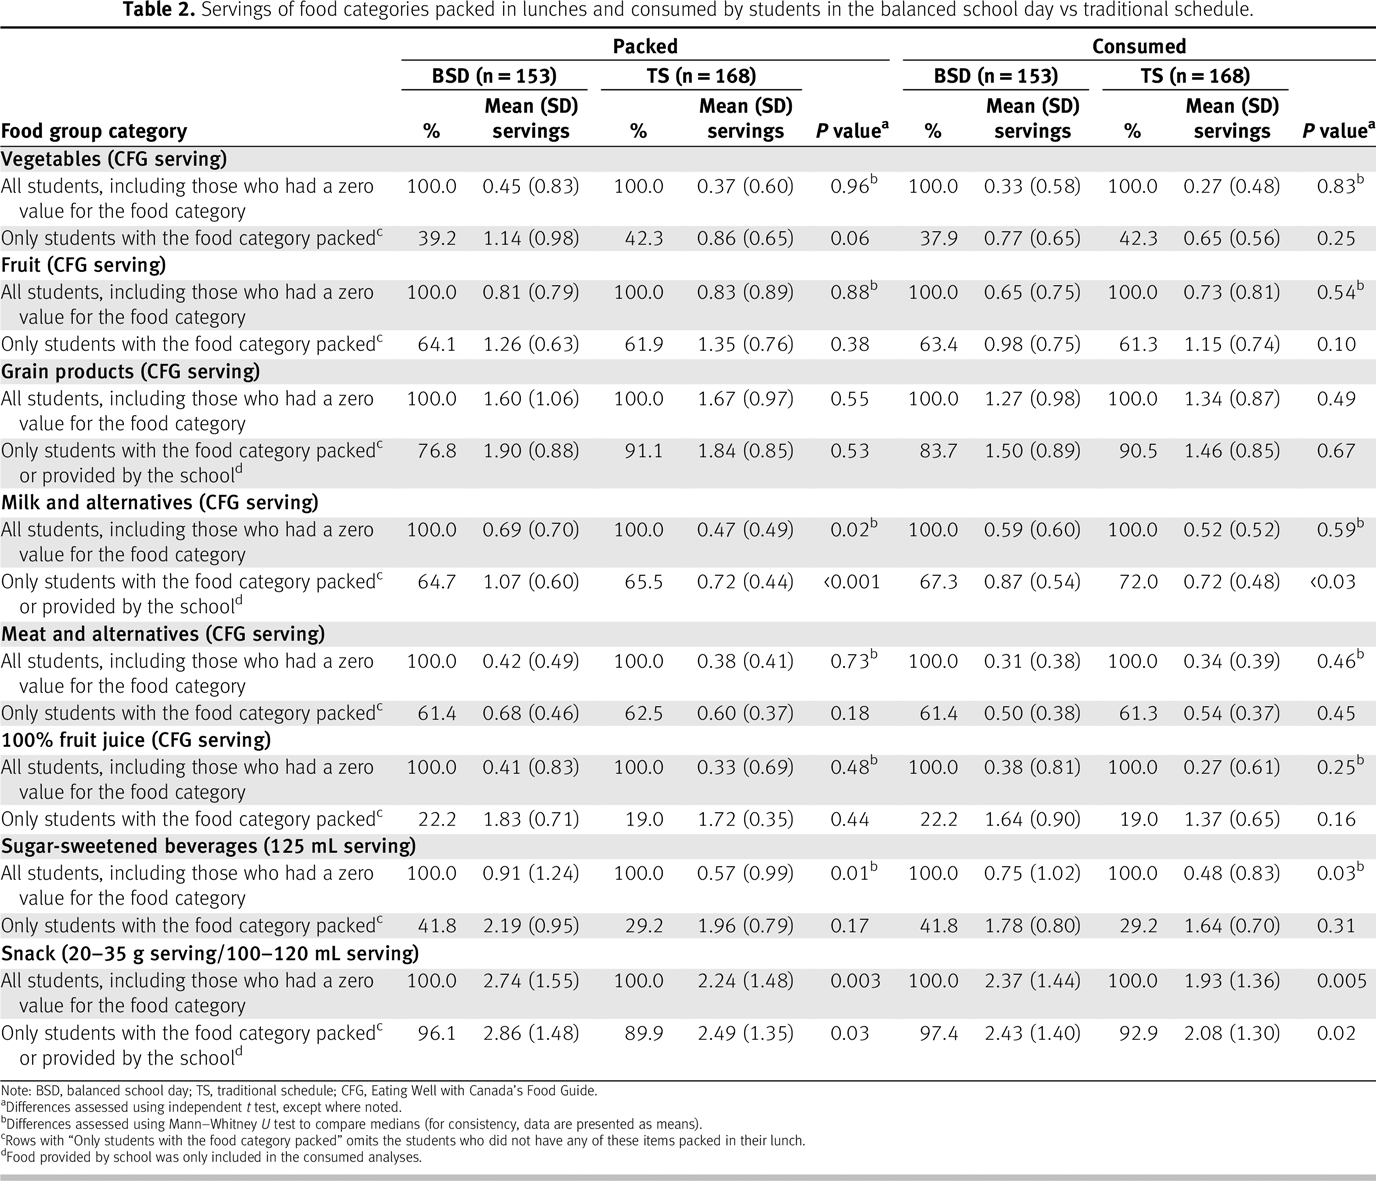
Results: The mean (SD) servings of foods packed in BSD lunches were significantly higher than the TS lunches for milk and alternatives (0.69 (0.70) vs 0.47 (0.49), P = 0.02), sugar-sweetened beverages (SSBs; 0.91 (1.24) vs 0.57 (0.99), P = 0.01), and snacks (2.74 (1.55) vs 2.24 (1.48), P < 0.01). Regardless of schedule, only 40.8% of students had vegetables packed in their lunch, whereas 92.8% had snacks. When comparing foods eaten, SSBs and snacks remained significantly higher in the BSD (0.75 (1.02) vs 0.48 (0.83), P = 0.03; 2.37 (1.44) vs 1.93 (1.36), P = 0.01, respectively). The proportion of children (%) whose consumption met one-third of Canada’s Food Guide recommendations for vegetables and fruit was low (27.5% BSD, 31.0% TS).
Conclusions: The BSD may have unintended negative consequences on the type and amount of foods packed in school lunches. Support for families should focus on encouraging more vegetables and fruit and fewer SSBs and snacks in packed lunches.

Résumé

Objectif : Évaluer le type et la quantité d’aliments que les enfants apportent et consomment à l’école durant la journée scolaire équilibrée (JSE), qui comprend deux périodes de 20 minutes pour manger, comparativement à l’horaire traditionnel (HT), qui comprend une période de dîner de 20 minutes.
Méthodes : Observation directe pour déterminer le type et la quantité d’aliments que consomment les enfants de 3e et de 4e année (n = 231) pour le dîner dans le cadre de la JSE et de l’HT.
Résultats : Le nombre moyen de portions (écart-type) dans les boîtes à lunch associé à la JSE était significativement plus élevé que celui des boîtes à lunch de l’HT pour la catégorie lait et substituts (0,69 (0,70) vs 0,47 (0,49), P = 0,02), les boissons sucrées (0,91 (1,24) vs 0,57 (0,99), P = 0,01) et les collations (2,74 (1,55) vs 2,24 (1,48), P < 0,01). Peu importe l’horaire, seulement 40,8 % des boîtes à lunch contenaient des légumes, alors que 92,8 % contenaient des collations. Lorsque l’on compare les aliments consommés, les boissons sucrées et les collations étaient significativement plus présentes pour la JSE (0,75 (1,02) vs 0,48 (0,83), P = 0,03; 2,37 (1,44) vs 1,93 (1,36), P = 0,01, respectivement). La proportion d’enfants (%) dont la consommation respectait un tiers des recommandations du Guide alimentaire canadien pour les légumes et les fruits était faible (27,5 % pour la JSE et 31 % pour l’HT).
Conclusions : La JSE pourrait entraîner des conséquences négatives non désirées sur le type et la quantité d’aliments contenus dans les boîtes à lunch. Le soutien aux familles devrait être axé sur l’augmentation de la quantité de légumes et de fruits et la diminution des boissons sucrées et des collations dans les boîtes à lunch.

INTRODUCTION

In Canada, most foods consumed in elementary schools are brought from home, as school meal programs are not publically funded [1]. Some foods are available for purchase at school; however, purchases are generally from external food caterers or franchisees and the frequency of availability varies by school. Unfortunately, home-packed lunches in the United Kingdom and United States are of lower nutritional quality than school meals, providing more savoury and confectionery snacks and fewer fruit and vegetables [24]. Few studies have examined the quality or type of foods packed at home and consumed by Canadian school children. One study, however, found the nutritional quality of both home-packed and school-purchased lunches was lacking when compared with one-third of the Dietary Reference Intakes for magnesium, potassium, zinc, folate, fibre, and vitamins A, D, C, and B6 [5]. In this study, foods purchased from school were provided by external sources, including fast-food outlets.
In addition to concerns about home-packed lunches, there have also been changes to the elementary-school schedule in some provinces in Canada that may impact children’s consumption of foods at school [6]. The balanced school day (BSD) provides an alternative schedule for school-day breaks, compared with the well-established traditional schedule (TS) [6]. This alternative schedule was a staff-driven timetable change that addressed the specific needs of an Ontario school in 2000–2001, and it has since been implemented in many other individual schools and/or school boards [6, 7]. The BSD has two 45-minute breaks, each with 20 minutes for eating and 25 minutes for recess [6]. In comparison, the TS provides 20 minutes for eating at lunch together with 40 minutes for recess, plus two 15-minute recesses for snacks and/or activities [6, 8]. According to school board websites, widespread implementation of the BSD has occurred in Ontario, but the extent is difficult to quantify as it is neither government mandated nor monitored [911]. Limited evaluation of the potential health impacts (e.g., children’s food intake) has taken place. One study, comparing nutrient compositions of packed lunches consumed by students attending 1 BSD to 1 TS school, found significantly more beverages were provided in BSD home-packed lunches (1.42 vs 1.18 beverages per day, P = 0.04), but the volume and calories from beverages were not significantly different, nor were the intakes of macronutrients and micronutrients [12]. More data using a larger number of schools and students is required; however, because it is possible that with 2, instead of 1, 20-minute eating breaks, parents may pack more food and beverages in their child’s lunch. The purpose of the present study was to compare the type, quantity, and adequacy of foods children are bringing and consuming at schools implementing the BSD compared with those at TS schools, using a valid and reliable direct observation method [13].

METHODS

Participants

Elementary schools in Southwestern Ontario were recruited to participate. Grade 3 and 4 students (aged 7–10 years), from participating schools were invited, as older students may have reached a stage of puberty where rapid growth could impact food intake [14]. Parents completed a survey to obtain demographic information including child’s sex and date of birth, as well as parental education and income. The study was approved by Western University’s Non-Medical Research Ethics Board with concurrent Thames Valley District School Board approval. Principals, parents, and children all provided informed consent.

Dietary assessment

Direct food observation, recording all visible food and beverages packed and consumed during all eating periods of a school day, was utilized. This method has demonstrated efficacy in school settings, and is accurate and reliable when conducted by trained individuals [13, 15, 16]. Full details of the methodology and assessment of validity and reliability have been described elsewhere [13].
Observation dates were not disclosed to parents or students to minimize influence on students’ packed lunches. Food items were classified into 8 categories: grain products, milk and alternatives (Milk/Alt), meat and alternatives, fruit, vegetables, 100% fruit juice, sugar-sweetened beverages (SSBs), and snacks. Vegetables, fruit, fruit juice, and SSBs were recorded as separate categories to determine their individual contributions to packed-lunch intake, as packed lunches are reportedly high in sugar [4, 17] with few vegetables [2, 4, 18, 19]. Vegetables included those served independently and as part of an entree (main course). One serving of SSB was identified as 125 mL for comparison with an Eating Well with Canada’s Food Guide (CFG) serving of 100% fruit juice. A snack serving was based on reference amounts established by Health Canada [20] as well as typical packaging sizes of commonly available prepackaged snacks (20–35 g or 100–120 mL). Food or beverages not provided from home and obtained from a school milk, snack, or breakfast program were only recorded as consumed.
Snacks, for which there is no standard definition, have been classified by varying methods in the literature, i.e., nutrient cut-off values [4], sweet and savoury taste [2], level of processing [21], time of day consumed [22], Health Canada’s Bureau of Nutritional Sciences (BNS) food group classifications [22], and energy density [23]. In this study, a snack was defined as a non-entree, non-beverage, non-fresh fruit or vegetable, sweet or savoury item, packaged for consumption in 1 sitting. In addition, snack items were grouped into BNS food group classifications (i.e., sweet snacks, crackers and cereal, baked goods, dairy, popcorn and chips, nuts and seeds, and other snacks) [24]. A few items fit into both a snack category and a CFG group and were recorded as both, to ensure the food item was represented in comparison with CFG. The age range of participating students (7–10 years) spanned 2 age-group recommendations in CFG (4–8 years and 9–13 years); thus, the analyses comparing consumption with CFG was stratified by age group.

Statistical analyses

Statistical analyses were performed using SPSS 21.0 (IBM Corp. 2012, Armonk, New York). Descriptive statistics were generated for demographic data and outcome variables according to school schedule (BSD vs TS). Chi-squared tests assessed the proportion of children receiving each food category packed in their lunch and achieving one-third of CFG recommendations by school schedule. Lunch-time consumption data were compared with one-third of recommendations to reflect the American Dietetic Association’s recommendation for children to consume one-third of daily intake in programs lasting 4–7 hours, which encompasses the average length of a Canadian school day [25]. Mean servings of food categories packed and eaten in the BSD and TS were compared using independent samples t tests; however, the distributions of some food categories (e.g., vegetables) were negatively skewed because a large proportion of children had zero servings packed. For these food categories, median servings packed and eaten were compared using the Mann–Whitney U test, with means presented for consistency. Spearman’s rank correlation coefficients were conducted to assess the association between parental socio-economic status (SES; including income and education) and food categories showing significant differences between schedules. One-sample t tests or Wilcoxon’s signed-rank tests compared the mean or median servings, respectively, of food groups consumed to one-third of CFG recommendations (means presented for consistency). A P < 0.05 was considered statistically significant.

RESULTS

Of the 25 schools invited to participate, 10 TS and 9 BSD (71.4% and 81.8% response rate, respectively) schools agreed. Third- and fourth-grade children from 19 elementary schools (10 TS, n = 168; 9 BSD, n = 153) in Southwestern Ontario participated. Of the 731 children invited, 339 (46%) provided consent; however, the final response rate was reduced to 321 (44%), because 18 children were not available on observation days.
Characteristics of students are shown in Table 1. There were no significant differences between school schedules for sex, grade, or school location (urban vs rural). Students in the BSD were 3 months older than those in the TS (P < 0.001). Milk was available for students to purchase through school milk programs in 67% of BSD and 100% of TS schools.
Table 1.
Table 1. Characteristics of students by school schedule.
a
Differences assessed using independent samples t test.
b
Differences assessed using χ2 test.
A higher proportion of children in the BSD had SSBs and snacks packed in their lunch than TS children (41.8% vs 29.2% and 96.1% vs 89.9%, respectively, P < 0.05 for both; Table 2). There were no differences in other packed-food categories (Supplementary Figure 11). With respect to each BNS snack classification there were no significant differences by school schedule in the proportion of students with the items packed (data not displayed). The most prevalent BNS classification was baked goods with 71.9% of BSD and 63.7% of TS packed lunches containing these items (not significant; data not displayed).
Table 2.
Table 2. Servings of food categories packed in lunches and consumed by students in the balanced school day vs traditional schedule.

Note: BSD, balanced school day; TS, traditional schedule; CFG, Eating Well with Canada’s Food Guide.

a
Differences assessed using independent t test, except where noted.
b
Differences assessed using Mann–Whitney U test to compare medians (for consistency, data are presented as means).
c
Rows with “Only students with the food category packed” omits the students who did not have any of these items packed in their lunch.
d
Food provided by school was only included in the consumed analyses.
BSD students had more Milk/Alt, SSB, and snack servings packed than TS students (Table 2). Servings of snack and Milk/Alt items packed in lunches remained significantly higher in BSD lunches when students, who did not have the food category packed, were excluded. Although more BSD students than TS students had a SSB in their lunch (41.8% vs 29.2%, P < 0.05), the portion size of SSBs was similar between schedules when the analysis was confined to children who had a SSB packed in their lunch.
When comparing servings of food categories consumed (Table 2), SSBs and snacks were higher in the BSD versus TS schools. Students in the BSD schools also consumed more servings of Milk/Alts and snacks when the analysis included only those who had the category available to them (i.e., packed in their lunch, purchased from school, or provided through a snack program). Correlations between parental SES variables and Milk/Alt, SSB, and snacks (both packed and eaten) revealed that the only significant associations (P < 0.05) were with parental education and snacks (packed and eaten); however, the level of association was very low (r = −0.14 and −0.13, respectively), signifying little to no relationship. This suggests that parental SES is not responsible for the observed differences.
Table 3 shows the proportion of children achieving one-third of CFG recommendations for both packed and eaten food groups. More BSD packed lunches than TS provided enough Milk/Alts to meet one-third of daily recommendations; however, in both schedules less than half of children had adequate intakes of Milk/Alts.
Table 3.
Table 3. Proportion of children achieving one-third of CFG recommendations by school schedule (BSD vs TS).

Note: CFG, Eating Well with Canada’s Food Guide; BSD, balanced school day; TS, traditional schedule.

a
Differences assessed using χ2 test.
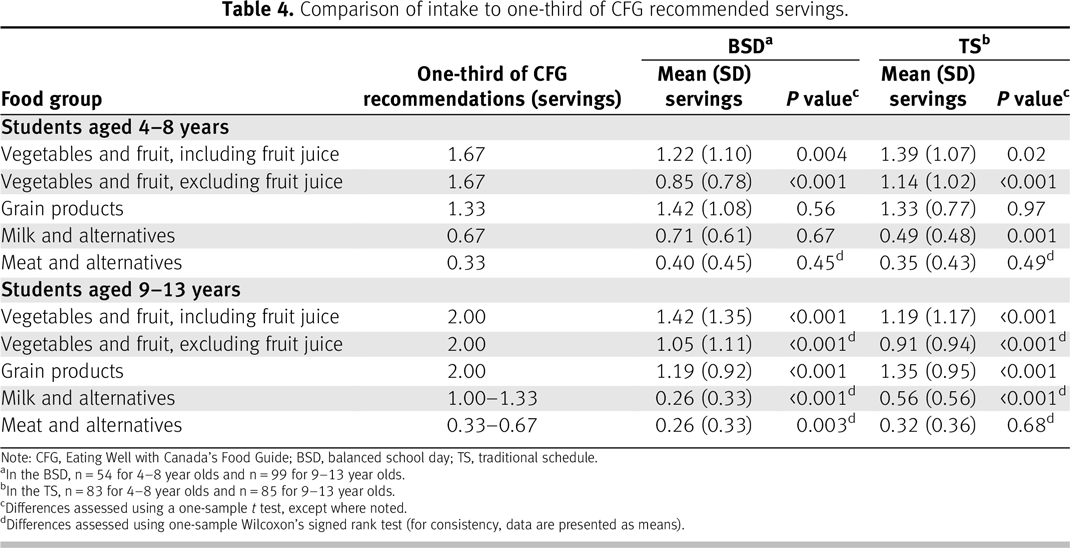
Stratified by CFG age-specific recommendations for children aged <9 years in both schedules, vegetable and fruit intake was significantly below one-third CFG recommendations (Table 4), and it was even lower with fruit juice excluded. TS students consumed < one-third of CFG recommendations for Milk/Alts; however, consumption of Milk/Alts by BSD students met recommendations.
Table 4.
Table 4. Comparison of intake to one-third of CFG recommended servings.

Note: CFG, Eating Well with Canada’s Food Guide; BSD, balanced school day; TS, traditional schedule.

a
In the BSD, n = 54 for 4–8 year olds and n = 99 for 9–13 year olds.
b
In the TS, n = 83 for 4–8 year olds and n = 85 for 9–13 year olds.
c
Differences assessed using a one-sample t test, except where noted.
d
Differences assessed using one-sample Wilcoxon’s signed rank test (for consistency, data are presented as means).
In both schedules, the mean intake of students aged ≥9 years failed to meet one-third of CFG recommendations for grain products, Milk/Alts, and vegetables and fruit. BSD students aged ≥9 years consumed less meat and alternatives servings than recommended, whereas intake by TS students did not differ from recommendations (Table 4).
Regardless of school schedule, only 40.8% of students had vegetables and 62.9% had fruit (Supplementary Figure 11 displays data by school schedule), with 80.1% having vegetables and/or fruit. The proportions of children whose consumption met one-third of CFG recommendations for vegetables and fruit was also poor (27.5% BSD and 31.0% TS, not significant), and were further reduced when fruit juice was excluded from the analysis (16.3% BSD and 23.8% TS, not significant) (Table 3). For all students, the proportion of vegetables left uneaten was higher in both schedules (30% BSD and 20% TS), compared with <15% of snacks and SSBs left uneaten in both the BSD and TS (Supplementary Table 11).

DISCUSSION

This study is one of the first to investigate differences in packed-lunch contents and consumption of children in the BSD versus TS. A greater proportion of BSD students had snacks packed in their lunches, and the number of servings of snacks packed was also greater in the BSD. More BSD students had a SSB packed in their lunch; however, those who had a SSB packed had the same serving size on average, regardless of schedule. The results of Dorman et al. [12] also showed that children on the BSD had more beverages per day, although not confined to SSBs, yet there was no difference between schedules for total volume consumed [12]. Parents of children in the BSD may be providing a SSB, in addition to the beverage they would typically pack (e.g., water, milk, or 100% fruit juice), to ensure their child has something to drink during each 20-minute eating period.
The percentage of students with Milk/Alts in their lunch was similar between schedules, but the number of servings packed was significantly greater in BSD lunches. This is likely related to more TS schools offering a milk program to students, prompting TS parents to pack fewer Milk/Alts. This is also a probable explanation for fewer TS packed lunches meeting one-third of CFG recommendations; however, the proportion of children in the TS who consumed adequate Milk/Alts increased (compared with the proportion with Milk/Alts packed) due to consumption from milk purchased at school. Even after accounting for those who purchased milk from school, the average serving of Milk/Alts consumed was greater for BSD than for TS students. It is important to note, however, that less than 50% of students adequately met one-third of CFG recommendations for Milk/Alts, and the mean number of servings of Milk/Alts consumed by older students in both schedules was well below recommendations and also lower than that reported by another Canadian study of milk consumption during school lunches [26]. Similarly, fewer home-packed lunches in the United Kingdom and the United States provided a dairy item when compared with school-provided meals [4, 27]. In the American GREEN (Growing Right: Eating Eco-Friendly & Nutritious) Project Lunch Box Study, only 31% of home-packed lunches and 12% of home-packed snacks contained a portion of milk, yogurt, or cheese, and very few lunches (15%) and snacks (1%) met the federal school nutrition standard for milk (1 cup) [19]. Thus, promotion of Milk/Alts in home-packed lunches in both schedules appears necessary; however, further investigation of the possible reasons for this may be warranted. It is not known if parents have concerns about refrigeration, price, waste, or child preference. Certainly, low-fat milk would be a beneficial alternative to SSBs, as it provides less energy from sugar and is nutrient dense.
Compared with TS students, more BSD students received a snack in their home-packed lunch, and a greater number of snack servings were both packed and consumed in the BSD. Baked goods (e.g., cookies, granola bars) were the most common snacks packed in both school schedules. Snacks are also common in elementary school home-packed lunches in the United States, United Kingdom, and New Zealand [2, 17, 18]. In the United Kingdom, Evans et al. [2] reported that 60% of home-packed lunches contained savoury, 63% confectionery, and 40% both savory and confectionery snacks, none of which aligned with school-meal standards. Similarly, chips, cookies, and other snack foods were found in 28%–40% of American home-packed lunches [18] and 45%–57% of New Zealand home-packed lunches [17]. In another study, U.K. students with home-packed lunches consumed more non-permitted snacks, according to school-meal standards, than students with school meals, resulting in higher intakes of sugar, sodium, and percent of energy from saturated fat [3]. In contrast to the previous home-packed lunch literature, more students in our study had a snack item packed (89.9% TS and 96.1% BSD), probably due to the broader snack definition used in the present study. Some snack items may be perceived as healthy because they fit into a CFG category (e.g., individually packaged cheese, yogurt tubes); however, these items are packaged and marketed for consumption as snacks and often have high levels of fat, sugar, or salt. Also, they were not consumed as the main entrée, and as such, they were considered a snack, as per the research definition. Forthcoming nutrient analysis of these specific items will provide further insight on the nutritional quality of snacks being consumed in schools. Nevertheless, given the findings of previous packed-lunch studies, it is likely that greater portions of snacks consumed in the BSD are contributing to additional sugar, sodium, and saturated fat in BSD students’ intake during school.
Vegetables were packed in fewer students’ lunches than were other food categories. The mean serving size of vegetables was also quite small. These findings are consistent with other home-packed lunch studies, where vegetables have been found in only 5% [18], 11% [19], 13% [4], and 18% [2] of home-packed lunches. In the current study, a greater proportion of students received vegetables in their lunch (42.3% TS and 39.2% BSD), which may be due to the inclusion of all observed vegetables, including those contained within entrees or sandwiches. The average serving of vegetables and fruit consumed by students in both schedules did not meet one-third of CFG recommendations; however, it was comparable with the serving size found in another Canadian lunch study [28]. Overall, less than 50% of BSD and TS children met CFG recommendations for vegetable and fruit consumption, even when fruit juice was included as a serving. Notably, a greater proportion of observed packed vegetable servings were being left uneaten in both schedules, whereas snacks and SSBs were seldom left unconsumed. This is concerning because high sugar intake, from food items such as snack foods or SSBs, has been associated with decreased vegetable and fruit consumption and weight gain [2931]. If parents pack high-sugar foods and beverages, these items may displace vegetables and fruit, with children becoming satiated after consuming the preferential high-sugar foods and returning their packed vegetables and fruits home.
Multi-stakeholder approaches to increasing children’s vegetable and fruit consumption, while discouraging intake of SSBs and high-fat/high-sugar snacks, are warranted, particularly in the BSD, as consumption behaviours learned in childhood often extend into adulthood [32]. Multi-component interventions have been effective at increasing vegetable and fruit intake in a school setting [33, 34]. Education could support families by raising awareness of the importance of healthy eating for children and providing approaches to overcoming barriers to packing a healthy lunch. The American Academy of Pediatrics [35] recently identified the unregulated nature of home-packed lunches as an opportunity for pediatricians to collaborate with relevant health professionals such as dietitians, students, parents, and school staff to promote nutrient-rich foods in home-packed lunches, while limiting foods and beverages that provide few nutrients. Changes in children’s intake at school will require the concerted efforts of government and school boards, principals and teachers, parents, students, health professionals, and community members to address barriers parents encounter when packing lunches (e.g., financial, time, picky eating, allergy policy, etc.) [1, unpublished data].
A limitation of the present study relates to the unobtrusive nature of direct observation, whereby observers were only able to record visible food and beverages. Some food items, such as vegetables or fruit, may be underreported as packed items if children did not remove them from their lunch bag. This approach, however, minimizes unintended changes in food intake that could occur with more intrusive assessments. This observation methodology must also be interpreted as a strength, as it did not rely on parental proxy or student recall. Furthermore, our study assessed food intake at school, thus comparisons to one-third of CFG should be interpreted with caution as total daily food-group intake may be adequate once total 24-hour intake is accounted for. This could be especially apparent for food groups where parents have concerns about food safety (e.g., Milk/Alts). Although our school response rate was 76%, the individual participation rate was 44%; however, this is higher than the 32% participant response rate in Hubbard et al. [19]. Finally, only 1 cross-sectional observation day was collected per child, which represents group-level intake, but cannot be inferred to individual, usual intake [36].

RELEVANCE TO PRACTICE

The BSD may have unintended negative consequences on the quality and quantity of foods packed for school lunches. This could affect the school food environment, and may impact weight status over time. Support provided to families switching to the BSD should focus on encouraging more vegetables and fruit and fewer SSBs and snacks in packed lunches. Future research investigating interventions that will promote sustainable improvement in the quality of home-packed lunches in elementary schools is crucial.

Acknowledgements

The authors thank the many observers who participated in data collection and data inputting. We also thank the students, staff, and parents from the Thames Valley District School Board for their support of this project.

Footnote

1
Supplementary data are available with the article through the journal Web site at Supplementary Material.
Source of financial support: This research was funded through a grant from the Canadian Institutes of Health Research (PHO-123776) to Dr. Paula D.N. Dworatzek.
Conflict of interest: None to declare.

References

1
Healthy Kids Panel. No time to wait: the healthy kids strategy. Toronto, ON; 2013. 66 pp. [cited 2016 May 10]. Available from: http://www.health.gov.on.ca/en/common/ministry/publications/reports/healthy_kids/healthy_kids.pdf.
2
Evans CEL, Greenwood DC, Thomas JD, and Cade JE. A cross-sectional survey of children’s packed lunches in the UK: food- and nutrient-based results. J Epidemiol Community Heal. 2010 Nov;64(11):977–83.
3
Pearce J, Harper C, Haroun D, Wood L, and Nelson M.Short communication: key differences between school lunches and packed lunches in primary schools in England in 2009. Public Health Nutr. 2011 Aug;14(8):1507–10.
4
Johnston CA, Moreno JP, El-Mubasher A, and Woehler D.School lunches and lunches brought from home: a comparative analysis. Child Obes. 2012 Aug;8(4):364–68.
5
Taylor JP, Hernandez KJ, Caiger JM, Giberson D, MacLellan D, and Sweeney-Nixon M, et al.Nutritional quality of children’s school lunches: differences according to food source. Public Heal Nutr. 2012 Dec;15(12):2259–64.
6
Wu TF, Macaskill LA, Salvadori MI, and Dworatzek PD.Is the balanced school day truly balanced? A review of the impacts on children, families, and school food environments. J Sch Health. 2015;85(6):405–10.
7
Ontario Principals’ Council. The principal as instructional leader in literacy. Corwin: A Joint Publication with Ontario Principals’ Council; 2009.
8
Lafleur C. The balanced school day: challenging the traditional grammars of schooling. Canadian Society for the Study of Education Conference, Winnipeg, MB; 2004. p. 1–15.
9
Halton District School Board. ‘Balanced Day’ timetable to be implemented for all Halton public elementary schools in September 2003; 2003 [cited 2016 May 22]. Available from: http://www.hdsb.ca/Schools/Balanced School Day Timetable/NRBalancedDay.pdf.
10
Rainbow District School Board. Balanced school day; 2006 [cited 2016 May 22]. Available from: http://www.rainbowschools.ca/parents/balancedSchoolDay.php.
11
Grand Erie District School Board. Balanced school day; 2012 [cited 2016 May 22]. Available from: http://www.granderie.ca/Parents/BalancedSchoolDay/Pages/default.aspx.
12
Dorman SC, Gauthier AP, Laurence M, Thirkill L, and Kabaroff JL.Photographic examination of student lunches in schools using the Balanced School Day versus Traditional School Day Schedules. ICAN. 2013;5(2):78–84.
13
Richter SL, Vandervet LM, Macaskill LA, Salvadori MI, Seabrook JA, and Dworatzek PDN. Accuracy and reliability of direct observations of home-packed lunches in elementary schools by trained nutrition students. J Acad Nutr Diet.2012 Oct;112(10):1603–7.
14
Moses S. Female tanner stage [cited 2016 May 11]. Available from: http://www.fpnotebook.com/endo/exam/fmltnrstg.htm.
15
Baranowski T, Fleishman R, Forthofer R, Huang IW, and Debra B. Simons-morton BG. Reliability of direct observation of schoolchildren’s consumption of bag lunches. J Am Diet Assoc.1992;92(2):219–21.
16
Baglio ML, Baxter SD, Guinn CH, Thompson WO, Shaffer NM, and Frye FH.Assessment of interobserver reliability in nutrition studies that use direct observation of school meals. J Am Diet Assoc. 2004 Sept;104(9):1385–92.
17
Dresler-Hawke E, Whitehead D, and Coad J.What are New Zealand children eating at school? A content analysis of ‘consumed versus unconsumed’ food groups in a lunch-box survey. Health Educ J. 2009 Mar 1;68(1):3–13.
18
Conway TL, Sallis JF, Pelletier RL, Powers HS, Marshall SJ, and Zive MM, et al.What do middle school children bring in their bag lunches?Prev Med. 2002 Apr;34(4):422–27.
19
Hubbard KL, Must A, Eliasziw M, Folta SC, and Goldberg J.What’s in children’s backpacks: foods brought from home. J Acad Nutr Diet. 2014 Sept;114(9):1424–31.
20
Government of Canada. Food and Drug Regulations (C.R.C., c. 870): Schedule M; 2016 [cited 2016 May 30]. Available from: http://laws-lois.justice.gc.ca/eng/regulations/c.r.c.,_c._870/page-165.html#h-353.
21
Monteiro CA and Levy RB.A new classification of foods based on the extent and purpose of their processing. Cad Saude Publica. 2010;26(11):2039–49.
22
Gilbert J-A, Miller D, Olson S, and St-Pierre S.After-school snack intake among Canadian children and adolescents. Can J Public Health. 2012;103(6):e448–52.
23
Phillips SM, Bandini LG, Naumova EN, Cyr H, Colclough S, and Dietz WH, et al.Energy-dense snack food intake in adolescence: longitudinal relationship to weight and fatness. Obes Res. 2004 Mar;12(3):461–72.
24
Health Canada. Nutrient values of some common foods; 2008. p. 1–68 [cited 2016 May 20]. Available from: http://www.hc-sc.gc.ca/fn-an/nutrition/fiche-nutri-data/nutrient_value-valeurs_nutritives-tc-tm-eng.php.
25
American Dietetic Association. Position of the American Dietetic Association: benchmarks for nutrition in child care. J Am Diet Assoc. 2011 Apr;111(4):607–15.
26
Henry C, Whiting SJ, Phillips T, Finch SL, Zello GA, and Vatanparast H.Impact of the removal of chocolate milk from school milk programs for children in Saskatoon, Canada. Appl Physiol Nutr Metab. 2015;40(3):245–50.
27
Rogers IS, Ness AR, Hebditch K, Jones LR, and Emmett PM. Quality of food eaten in English primary schools: school dinners vs packed lunches. Eur J Clin Nutr.2007 Jul;61(7):856–64.
28
Woodruff SJ, Hanning RM, and McGoldrick K.The influence of physical and social contexts of eating on lunch-time food intake among Southern Ontario, Canada, middle school students. J Sch Health. 2010 Oct;80(9):421–28.
29
Øverby NC, Lillegaard ITL, Johansson L, and Andersen LF. High intake of added sugar among Norwegian children and adolescents. Public Health Nutr. 2004 Apr;7(2):285–93.
30
Johnson L, Mander AP, Jones LR, Emmett PM, and Jebb SA.Energy-dense, low-fiber, high-fat dietary pattern is associated with increased fatness in childhood. Am J Clin Nutr. 2008 Apr;87(4):846–54.
31
Malik VS, Schulze MB, and Hu FB.Intake of sugar-sweetened beverages and weight gain: a systematic review. Am J Clin Nutr. 2006 Aug;84(2):274–88.
32
Te Velde SJ, Twisk JWR, and Brug J.Tracking of fruit and vegetable consumption from adolescence into adulthood and its longitudinal association with overweight. Br J Nutr. 2007 Aug;98(2):431–8.
33
Knai C, Pomerleau J, Lock K, and McKee M.Getting children to eat more fruit and vegetables: a systematic review. Prev Med. 2006 Feb;42(2):85–95.
34
French SA and Stables G.Environmental interventions to promote vegetable and fruit consumption among youth in school settings. Prev Med. 2003 Dec;37(6):593–610.
35
American Academy of Pediatrics. Snacks, sweetened beverages, added sugars, and schools. Pediatrics. 2015;135(3):D1–4.
36
McPherson RS, Hoelscher DM, Alexander M, Scanlon KS, and Serdula MK.Dietary assessment methods among school-aged children: validity and reliability. Prev Med. 2000 Aug;31(2):S11–33.

Supplementary Material

File (cjdpr-2016-024_suppl-figure 1.pdf)
File (cjdpr-2016-024_suppl-table 1.pdf)

Information & Authors

Information

Published In

cover image Canadian Journal of Dietetic Practice and Research
Canadian Journal of Dietetic Practice and Research
Volume 78Number 1March 2017
Pages: 3 - 10

History

Received: 4 January 2016
Accepted: 8 July 2016
Version of record online: 25 October 2016

Authors

Affiliations

Lisa J. Neilson
Division of Food and Nutritional Sciences, Brescia University College at Western University, London, ON
Lesley A. Macaskill
Division of Food and Nutritional Sciences, Brescia University College at Western University, London, ON
Jonathan M.H. Luk
Division of Food and Nutritional Sciences, Brescia University College at Western University, London, ON
Navreeti Sharma
Division of Food and Nutritional Sciences, Brescia University College at Western University, London, ON
Steve M. Killip
Thames Valley District School Board, London, ON
Marina I. Salvadori
Department of Paediatrics, Schulich School of Medicine and Dentistry, Western University, London, ON
Jamie A. Seabrook
Division of Food and Nutritional Sciences, Brescia University College at Western University, London, ON
Department of Paediatrics, Schulich School of Medicine and Dentistry, Western University, London, ON
Children’s Health Research Institute, London, ON
Lawson Health Research Institute, London, ON
Paula D.N. Dworatzek
Division of Food and Nutritional Sciences, Brescia University College at Western University, London, ON
Schulich Interfaculty Program in Public Health, Schulich School of Medicine & Dentistry, Western University, London, ON

Metrics & Citations

Metrics

Other Metrics

Citations

Cite As

Export Citations

If you have the appropriate software installed, you can download article citation data to the citation manager of your choice. Simply select your manager software from the list below and click Download.

Cited by

1. Acceptability, Helpfulness, and Utility of the Healthy Lunch Box Booklet (HLBB) for Parents and School-Age Children
2. Parental Reports of Lunch-Packing Behaviours Lack Accuracy: Reported Barriers and Facilitators to Packing School Lunches

View Options

View options

PDF

View PDF

Get Access

Login options

Check if you access through your login credentials or your institution to get full access on this article.

Subscribe

Click on the button below to subscribe to Canadian Journal of Dietetic Practice and Research

Purchase options

Purchase this article to get full access to it.

Restore your content access

Enter your email address to restore your content access:

Note: This functionality works only for purchases done as a guest. If you already have an account, log in to access the content to which you are entitled.

Media

Media

Other

Tables

Share Options

Share

Share the article link

Share on social media